Fig. 10
Download original image
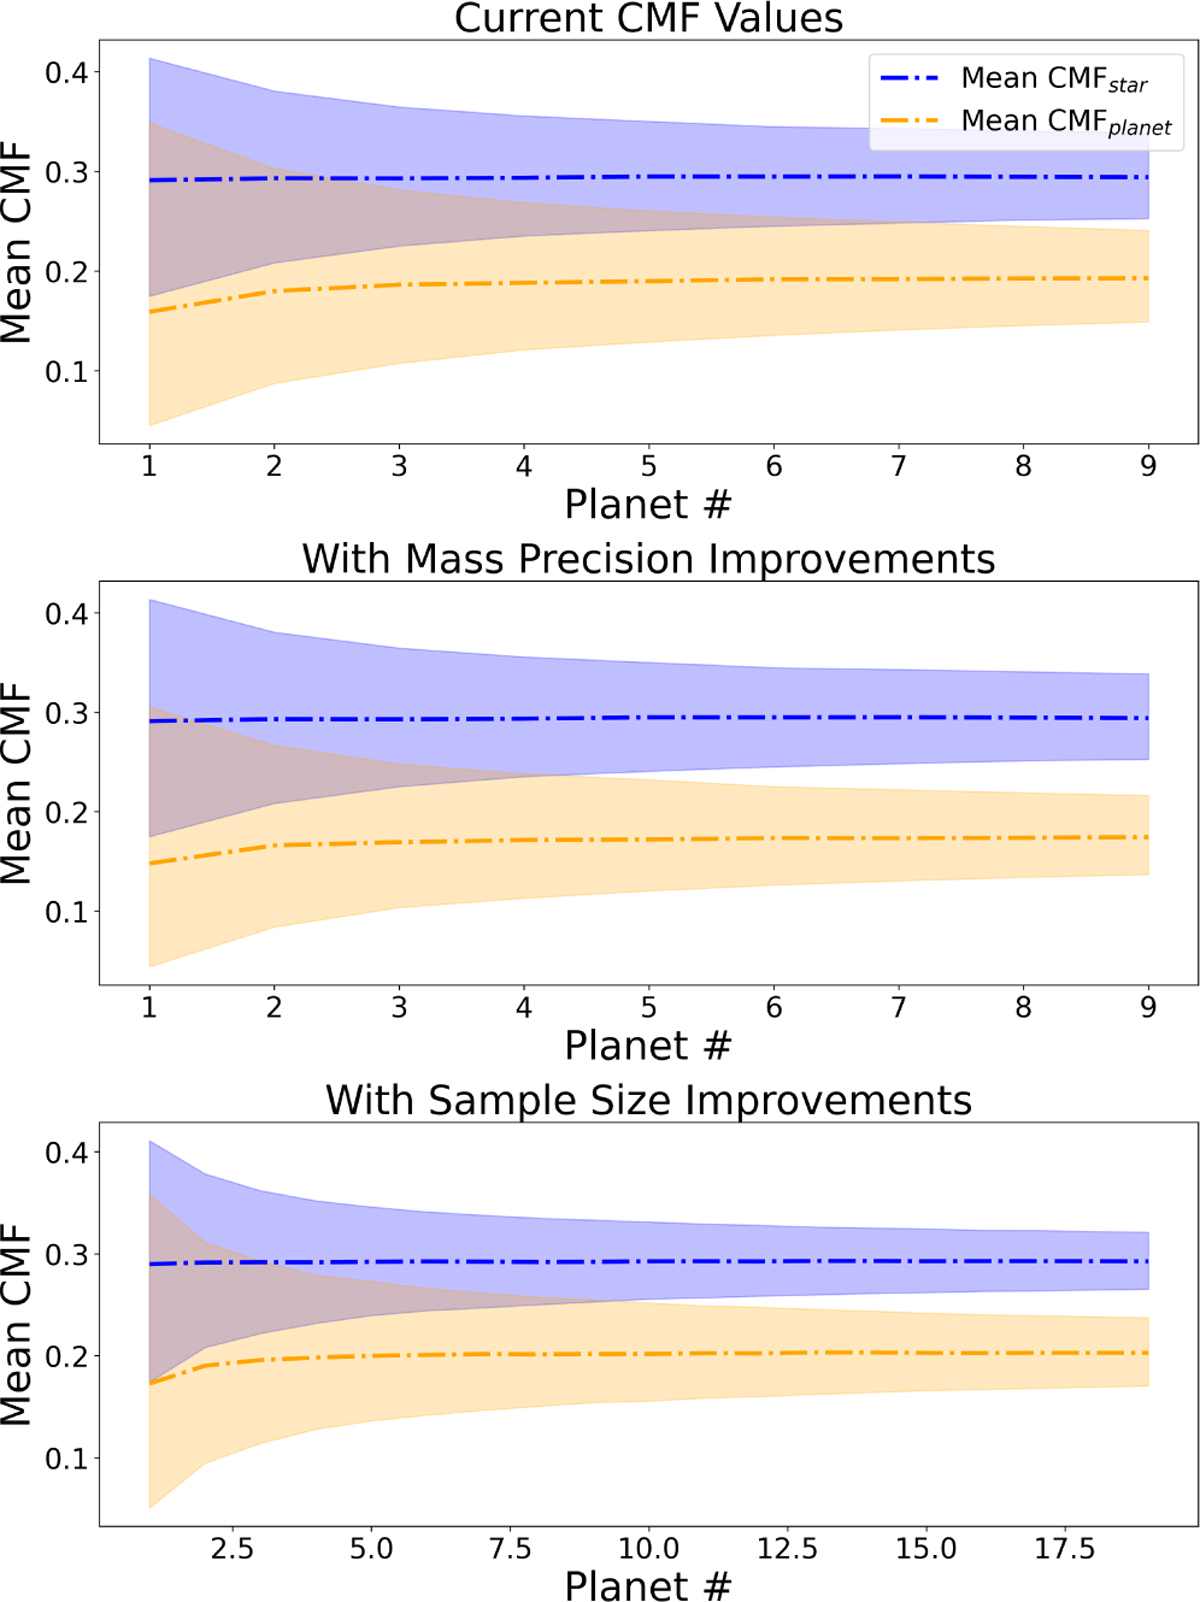
Distributions of the mean CMFplanet and CMFstar values as a function of the number of planets, for our current sample (top), for an observation campaign focused on improving the masses of planets already in our current sample (middle), and for an observation campaign focused on increasing the size of our sample (bottom). The dashed lines represent the median values of our CMF distributions, while the shaded regions represent the 1σ upper and lower regions.
Current usage metrics show cumulative count of Article Views (full-text article views including HTML views, PDF and ePub downloads, according to the available data) and Abstracts Views on Vision4Press platform.
Data correspond to usage on the plateform after 2015. The current usage metrics is available 48-96 hours after online publication and is updated daily on week days.
Initial download of the metrics may take a while.