Fig. B.3
Download original image
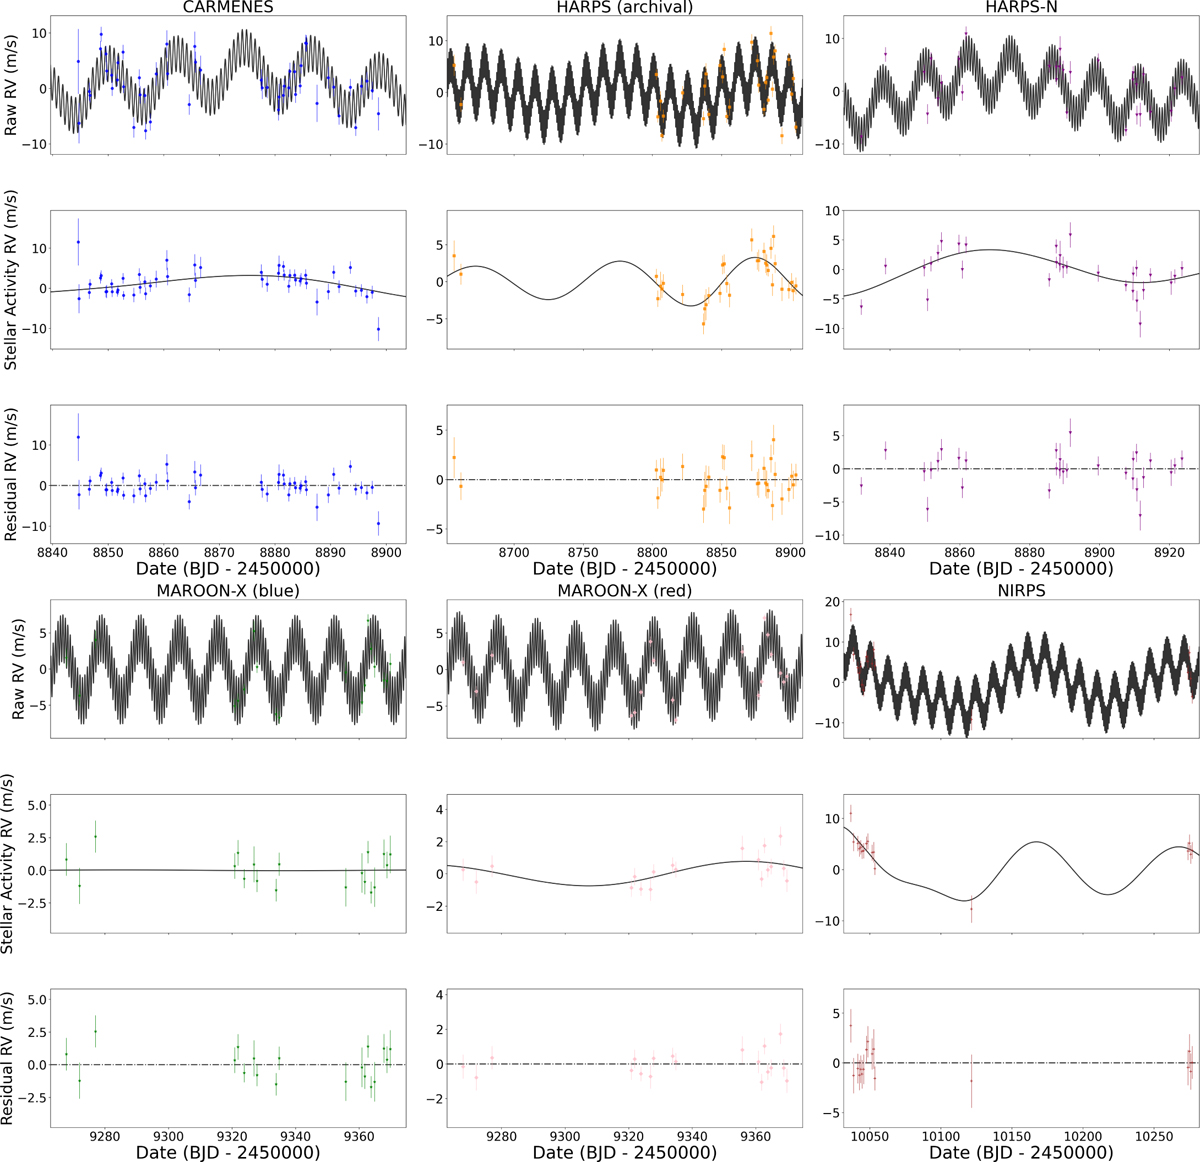
The RV time series used in the LTT 3780 RV modeling. Each set of three rows shows the RV time series for a given instrument. The top row shows the mean-subtracted RV-time series for each instrument, with the maximum a-posteriori RV model shown in black, while the middle row shows just the stellar activity component of the RV time series, with the corresponding best-fit stellar activity signal shown in black. The residuals between the best-fit model and each time series are shown in the bottom row.
Current usage metrics show cumulative count of Article Views (full-text article views including HTML views, PDF and ePub downloads, according to the available data) and Abstracts Views on Vision4Press platform.
Data correspond to usage on the plateform after 2015. The current usage metrics is available 48-96 hours after online publication and is updated daily on week days.
Initial download of the metrics may take a while.