Fig. 6
Download original image
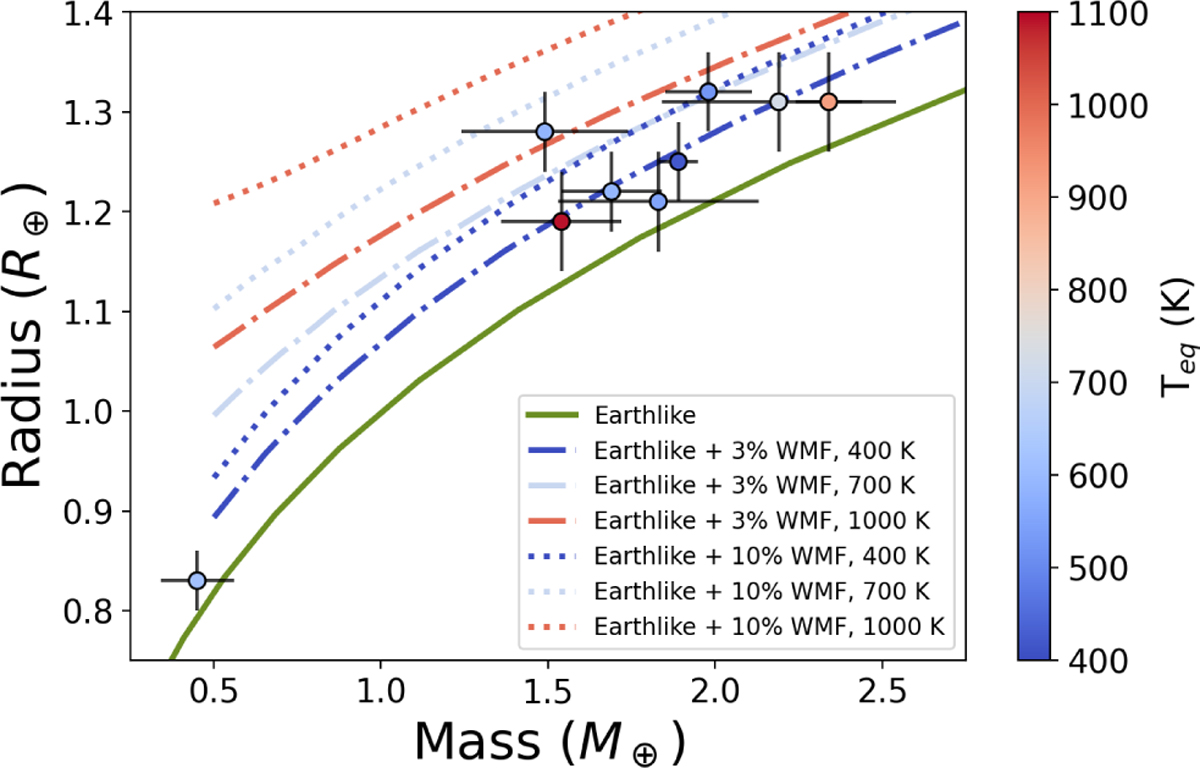
Reanalyzed radii vs. masses of all the planets in our sample. The colors of data points are determined based on equilibrium temperature, according to the colorbar. Several composition curves are overlaid. A curve corresponding to an Earth-like composition from Zeng et al. (2019) is shown as solid green line. Curves corresponding to water mass fractions of 3% (dash-dotted) and 10% (dotted) are shown at 400, 700, and 1000 K, and are linearly interpolated based on the same pretabulated models discussed in Section 6.4.
Current usage metrics show cumulative count of Article Views (full-text article views including HTML views, PDF and ePub downloads, according to the available data) and Abstracts Views on Vision4Press platform.
Data correspond to usage on the plateform after 2015. The current usage metrics is available 48-96 hours after online publication and is updated daily on week days.
Initial download of the metrics may take a while.