Fig. 9
Download original image
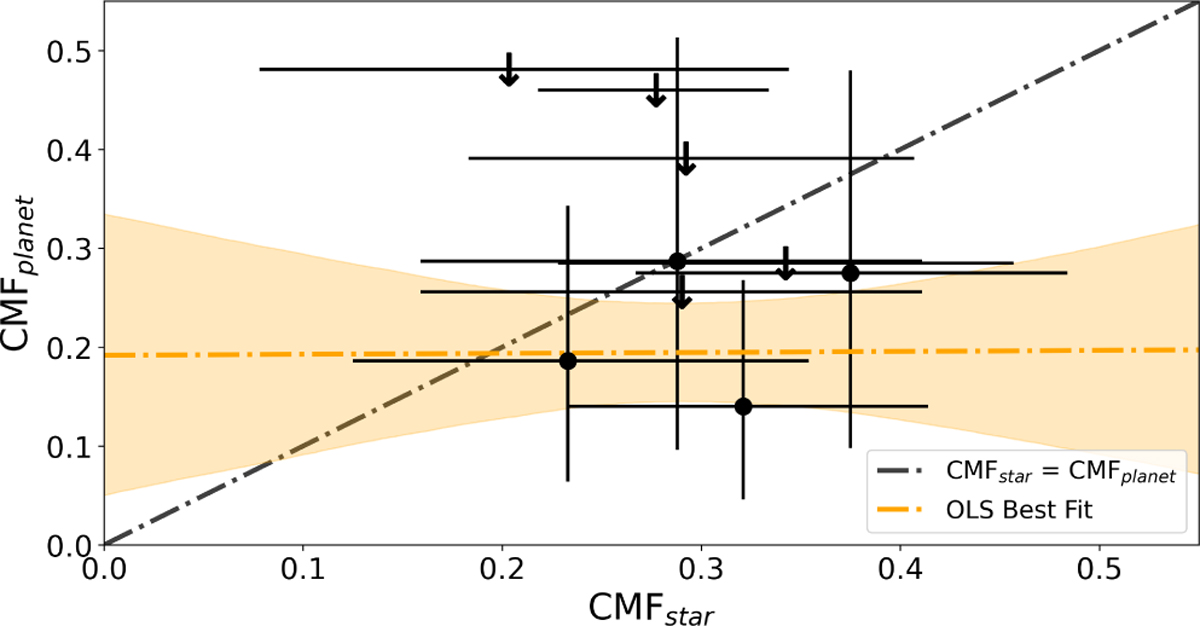
Correlation between CMFplanet and CMFstar for the nine hot super-Earths in our sample. The 95% upper limits are denoted with downward arrows. The line CMFplanet = CMFstar is overplotted as a dash-dotted black line. Our OLS fit with 1σ confidence intervals is shown in orange. The ODR fit is not shown here due to its high uncertainty.
Current usage metrics show cumulative count of Article Views (full-text article views including HTML views, PDF and ePub downloads, according to the available data) and Abstracts Views on Vision4Press platform.
Data correspond to usage on the plateform after 2015. The current usage metrics is available 48-96 hours after online publication and is updated daily on week days.
Initial download of the metrics may take a while.