Fig. 1.
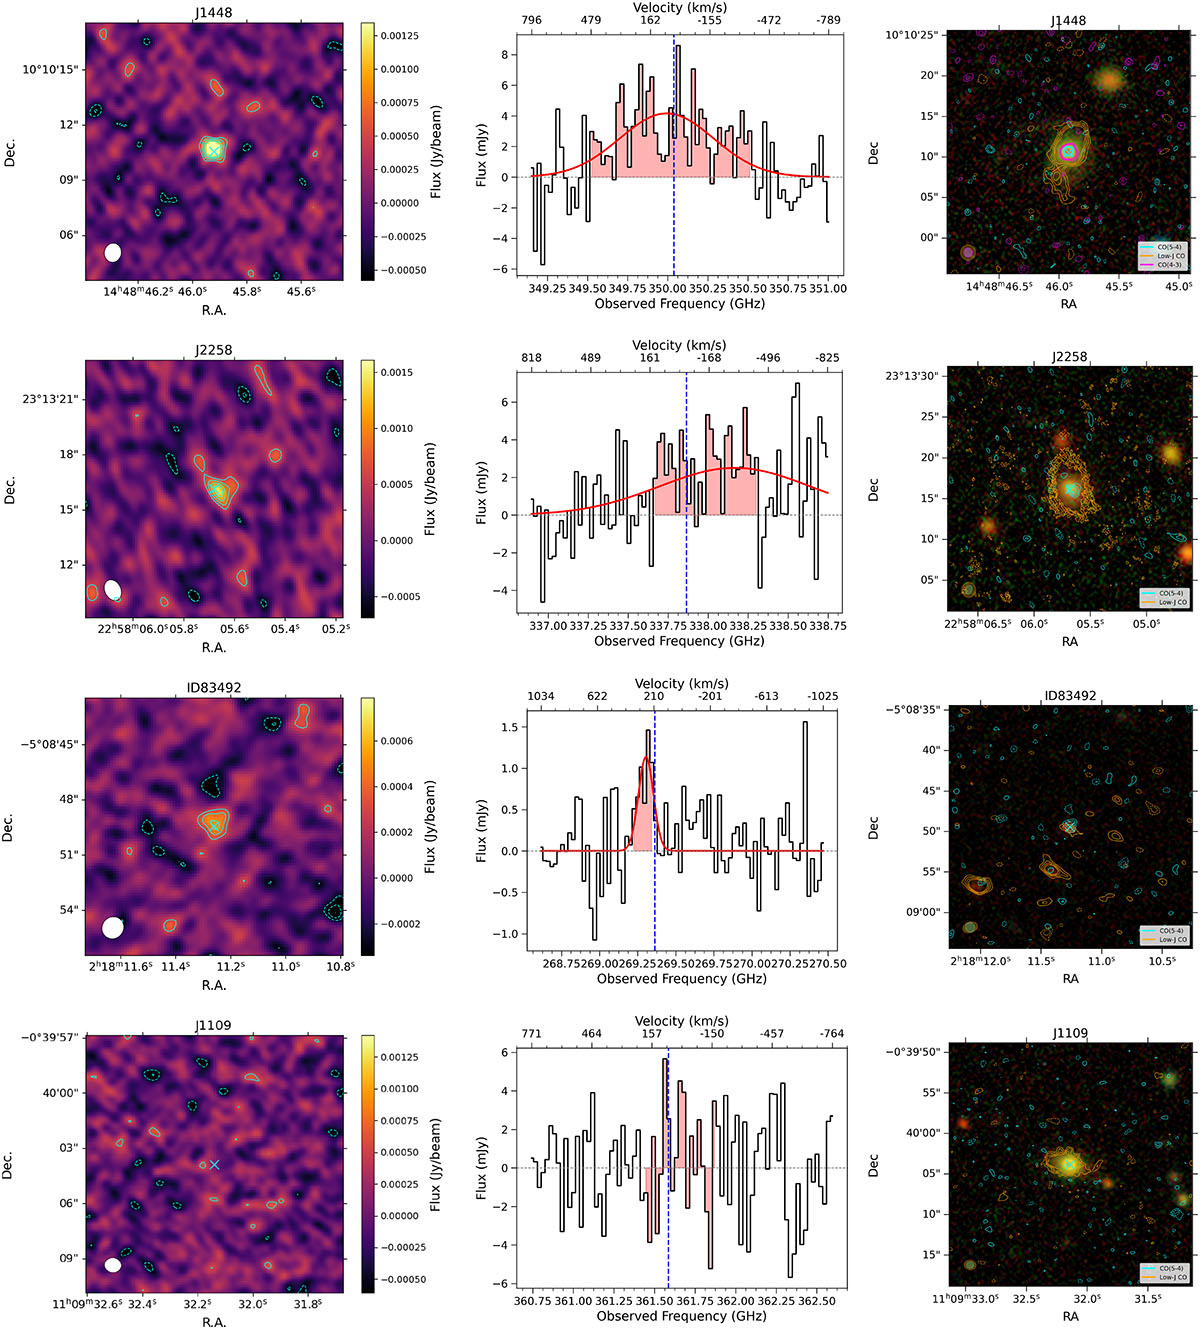
Download original image
ALMA data of our galaxies. First column: 2D maps of the CO(5–4) line. The solid and dashed cyan contours indicate, respectively, positive and negative levels of (2.5, 3.5, 4.5, 5.5) rms. The beam is reported in the bottom left corner (white ellipse). Each stamp has a size of 10″ × 10″. The cyan cross indicates the center of our post-SBs as estimated from the optical emission. Second column: 1D spectra of sources extracted using a PSF to maximize the signal-to-noise ratio (S/N). The shaded pink areas indicate the 1σ velocity range over which we measured the CO(5–4) line flux or its upper limit. For detections we also report the Gaussian fit of the emissions (Sect. 3.1). The vertical dashed lines indicate the observed frequency corresponding to the redshift of the low-J CO emission. Third column: Rest-frame optical grz images from the DESI Legacy Survey DR9 Dey et al. (2019). The cyan contours show the CO(5–4) emission, while the orange and pink indicate the low-J (CO(2–1) or CO(3–2)) or CO(4–3) emission, respectively. The ellipses indicate the beam size. Each stamp has a size of 20″ × 20″. The contour levels are the same as in the first panels. (Continues on page 6).
Current usage metrics show cumulative count of Article Views (full-text article views including HTML views, PDF and ePub downloads, according to the available data) and Abstracts Views on Vision4Press platform.
Data correspond to usage on the plateform after 2015. The current usage metrics is available 48-96 hours after online publication and is updated daily on week days.
Initial download of the metrics may take a while.