Fig. 4.
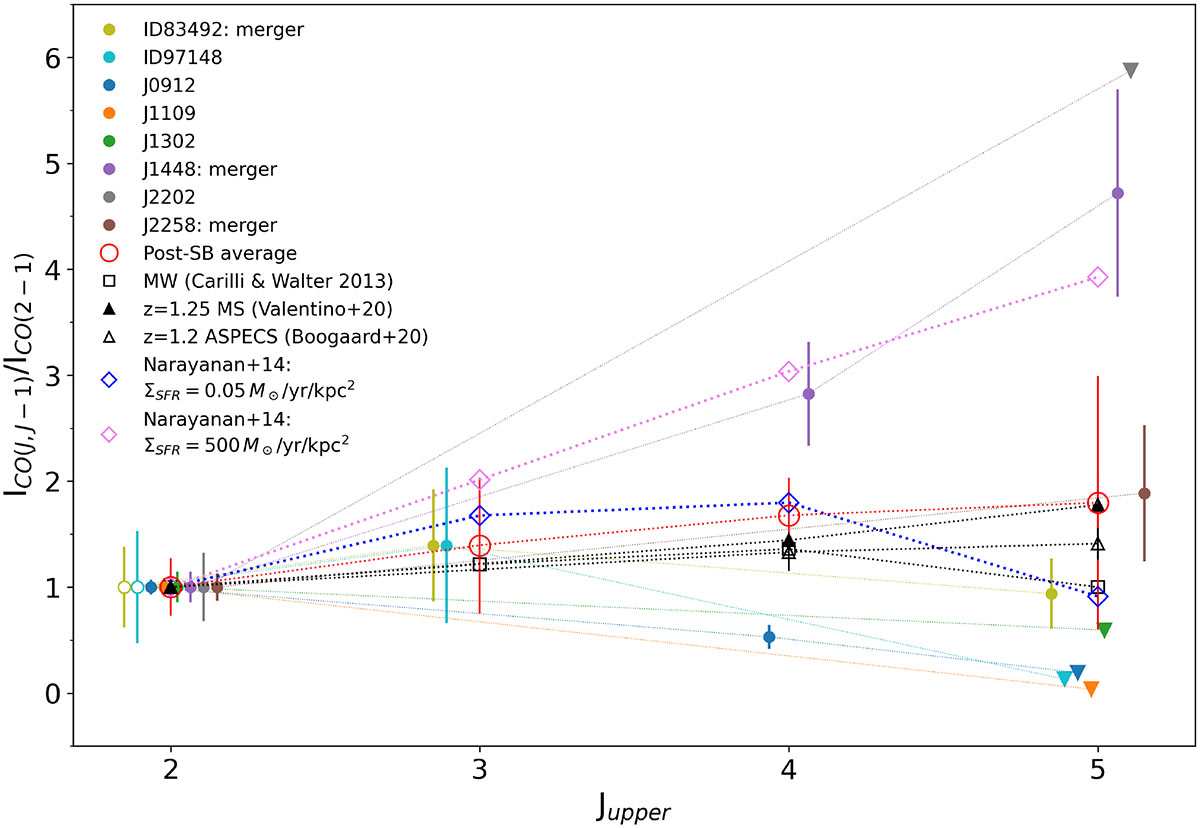
Download original image
CO SLED of our post-SB galaxies flux ratio. Individual galaxies are shown with small colored circles (measurements) and down-pointing triangles (3σ upper limits), while the average SLED is indicated by empty red circles. For comparison, we also show the Milky Way SLED (black squares; Carilli & Walter 2013), the average SLED of main-sequence galaxies (filled black triangles from Valentino et al. 2020 and empty black triangles from Boogaard et al. 2020), and the SLED predicted by the model of Narayanan & Krumholz (2014) assuming a SFR surface density of ΣSFR = 0.05 M⊙ yr−1 kpc−2 (blue diamonds) and ΣSFR = 500 M⊙ yr−1 kpc−2 (pink diamonds).
Current usage metrics show cumulative count of Article Views (full-text article views including HTML views, PDF and ePub downloads, according to the available data) and Abstracts Views on Vision4Press platform.
Data correspond to usage on the plateform after 2015. The current usage metrics is available 48-96 hours after online publication and is updated daily on week days.
Initial download of the metrics may take a while.