Open Access
Fig. 4.
Download original image
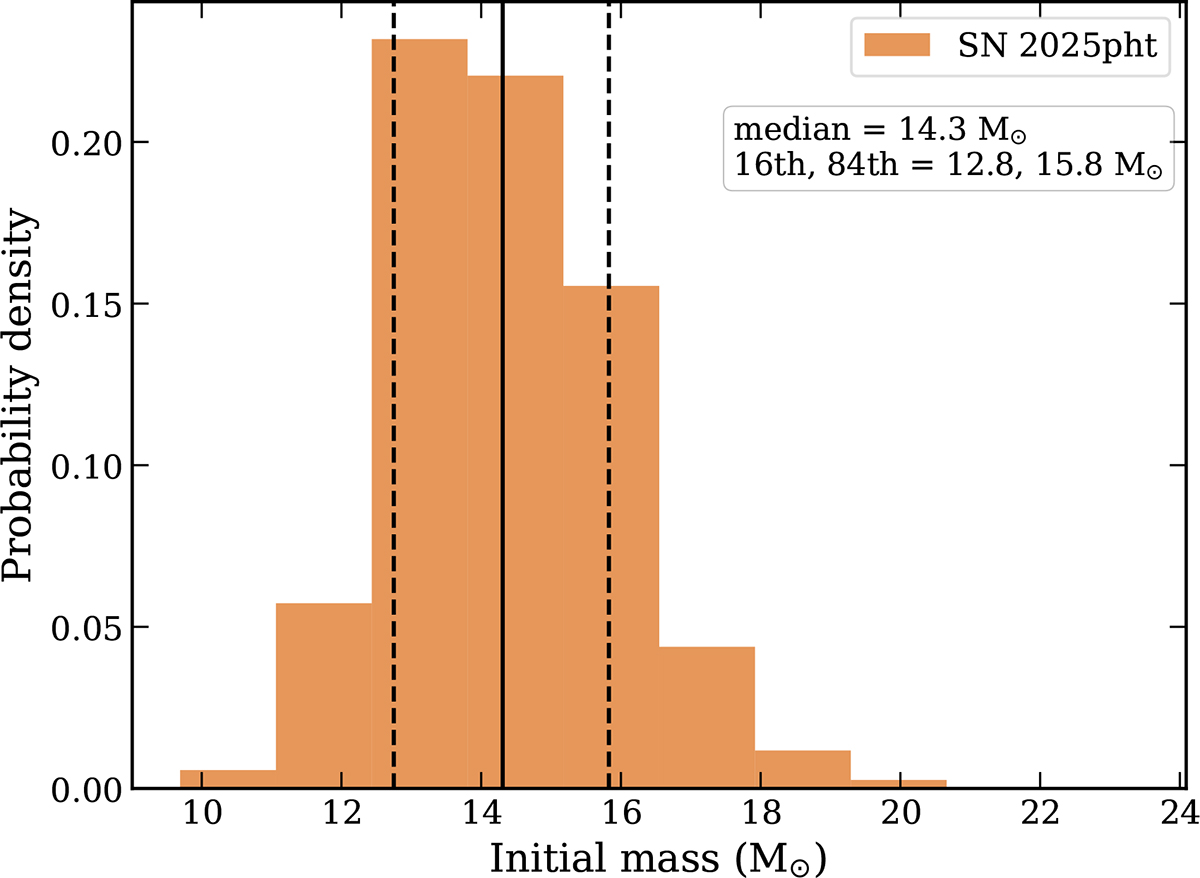
Initial-mass distribution of the progenitor of SN 2025pht using the DBR models. The solid vertical line corresponds to the median of the distribution, and dashed vertical lines are the 16th and 84th percentiles.
Current usage metrics show cumulative count of Article Views (full-text article views including HTML views, PDF and ePub downloads, according to the available data) and Abstracts Views on Vision4Press platform.
Data correspond to usage on the plateform after 2015. The current usage metrics is available 48-96 hours after online publication and is updated daily on week days.
Initial download of the metrics may take a while.