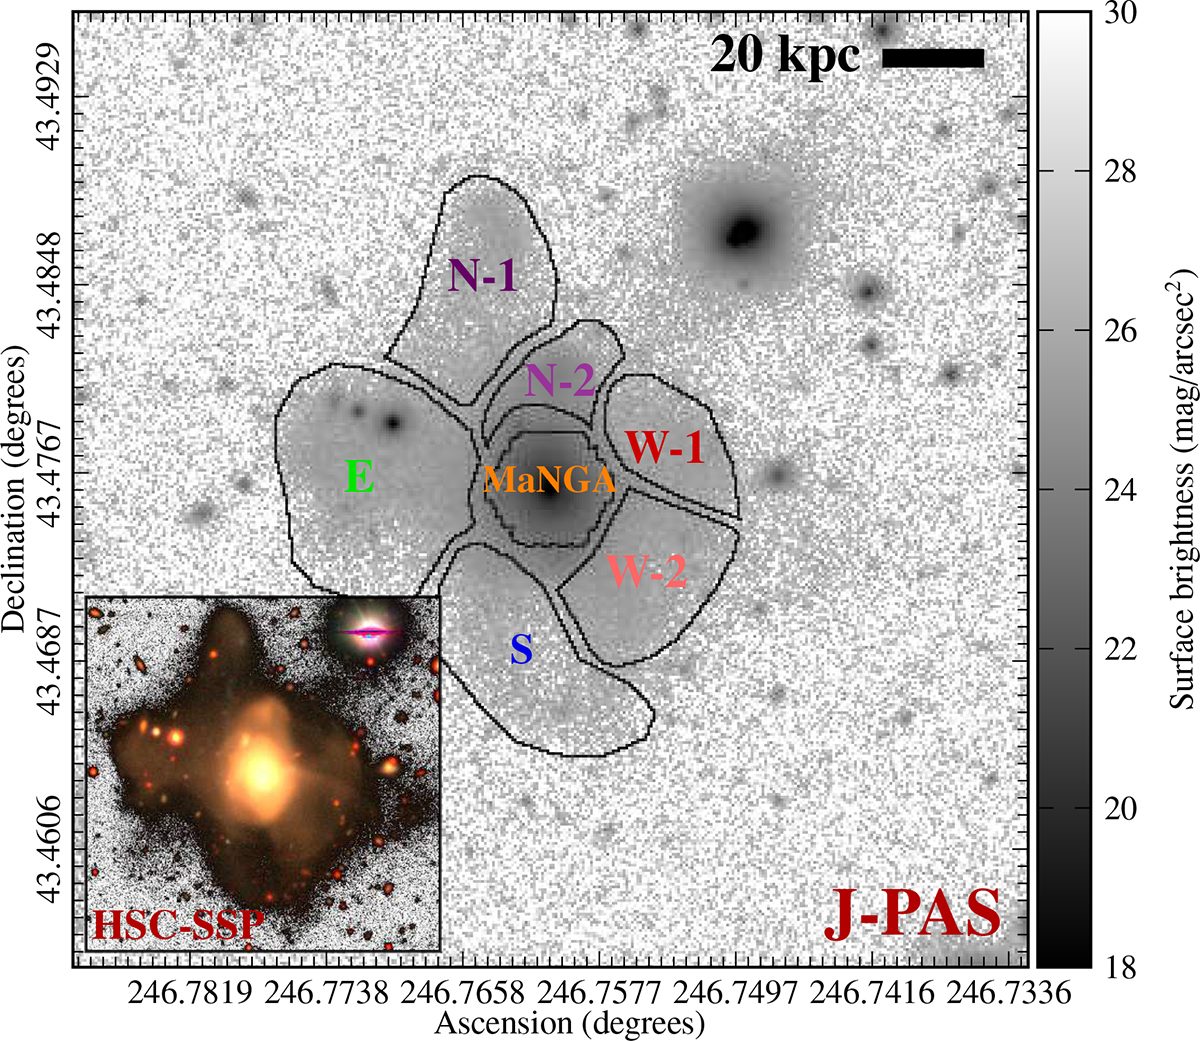
Fig. 1.
Download original image
Alba galaxy (PGC 3087775) and its major merger remnants. The main panel shows surface brightness image of the Alba galaxy that is produced by co-adding all 57 J-PAS bands (including 54 narrowband filters, two medium-band filters, and one broadband filter; however, only the 56 narrow and medium-band filters are used in the analysis presented in this paper). The co-add reaches a 3σ mSBL over 100 arcsec2 of 29 mag/arcsec2. The color bar represents the surface brightness of the co-added image. The hexagon over the center of the galaxy delineates the MaNGA footprint used to validate J-PAS SEDs in Fig. 2. The six polygons delineated with the thin lines, are named and studied independently in subsequent figures (with the same color-coding). The lower left panel displays a false-color image from the HSC-SSP (Subaru) wide survey, created using the z, r, and g filters as the red, green, and blue. Polygon coordinates are on Zenodo (see Appendix E.1).
Current usage metrics show cumulative count of Article Views (full-text article views including HTML views, PDF and ePub downloads, according to the available data) and Abstracts Views on Vision4Press platform.
Data correspond to usage on the plateform after 2015. The current usage metrics is available 48-96 hours after online publication and is updated daily on week days.
Initial download of the metrics may take a while.