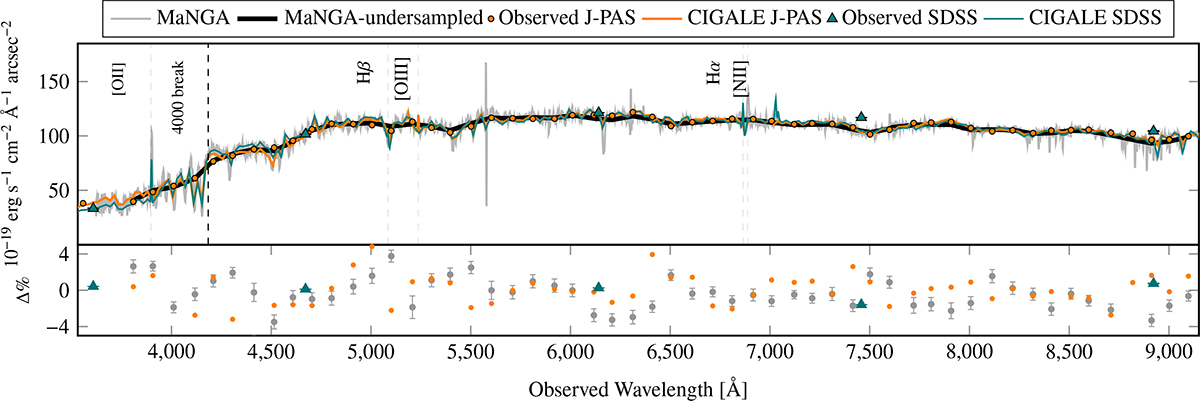
Fig. 2.
Download original image
Validation of J-PAS SEDs using MaNGA spectroscopy in the central region of the Alba galaxy (shown in Fig. 1). Top: Gray line indicates the MaNGA spectrum in this area, and the black line shows it after down-sampling with J-PAS filter throughputs. The orange points correspond to the measured J-PAS SED, and the solid orange line illustrates the best-fitting SED model derived from J-PAS data in the same region (after applying a minor constant correction factor of ×1.09 to all filters). Similarly, the teal triangles indicate the measured SDSS SED, and the solid teal line shows the corresponding SDSS SED fit (following the application of a small constant correction factor of ×0.96 to all filters). Some spectral line positions at the Alba galaxy redshift are also shown. Bottom: Percentage difference between the down-sampled MaNGA spectra and the J-PAS photometric data. This validates the very good calibration of J-PAS and allowed us to study regions beyond the small footprint of MaNGA. Furthermore, the orange and teal points and triangles represent the residuals between the SED fits derived from J-PAS and SDSS, respectively, and their corresponding observed fluxes. The dataset used to produce this plot can be accessed at Zenodo (see Appendix E.2).
Current usage metrics show cumulative count of Article Views (full-text article views including HTML views, PDF and ePub downloads, according to the available data) and Abstracts Views on Vision4Press platform.
Data correspond to usage on the plateform after 2015. The current usage metrics is available 48-96 hours after online publication and is updated daily on week days.
Initial download of the metrics may take a while.