Fig. 3.
Download original image
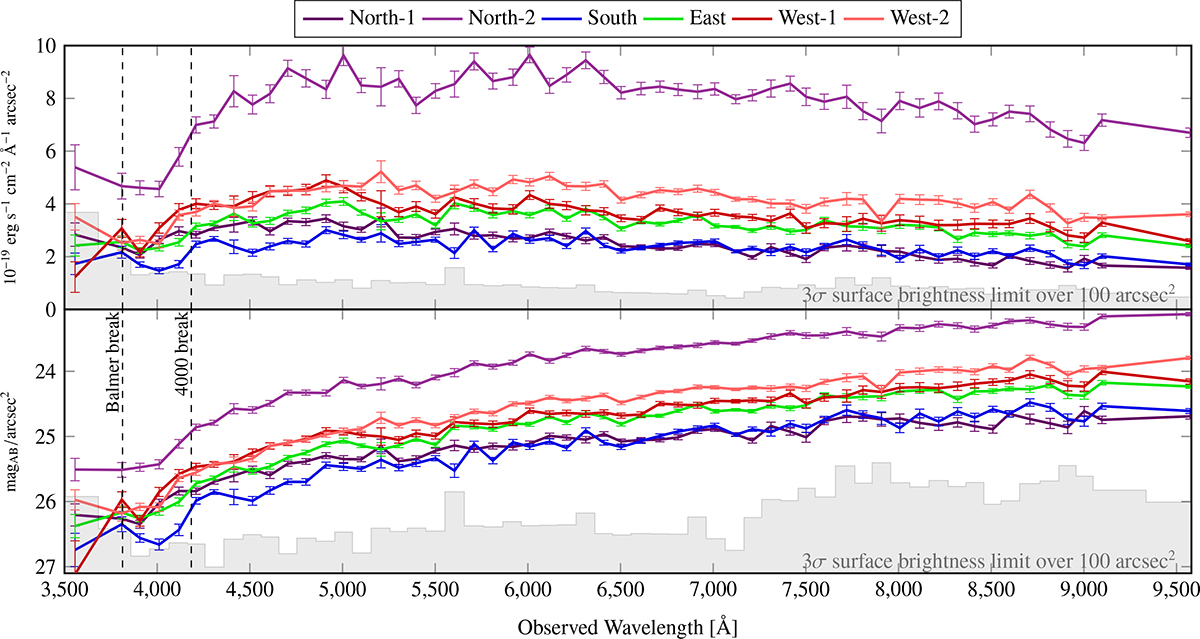
SED (in surface brightness) of different sections of the tidal feature, presented in two units. The top panel features units of wavelength flux density (used in the IFU community) of the six distinct polygons, while the lower panel features units of AB magnitude (used in the imaging community). The colors in this plot correspond to those used in Fig. 1 to represent different polygons. The gray bars at the bottom of each plot show the 3σ mSBL for each filter over an area of 100 arcsec2. The data used to generate this plot are available on Zenodo (see Appendix E.3).
Current usage metrics show cumulative count of Article Views (full-text article views including HTML views, PDF and ePub downloads, according to the available data) and Abstracts Views on Vision4Press platform.
Data correspond to usage on the plateform after 2015. The current usage metrics is available 48-96 hours after online publication and is updated daily on week days.
Initial download of the metrics may take a while.