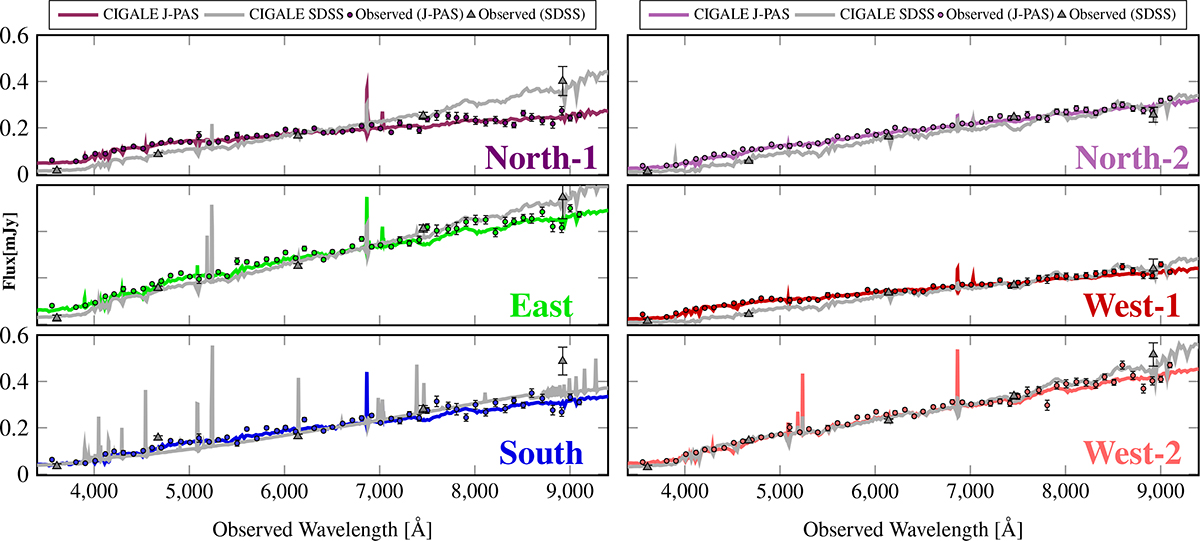
Fig. 4.
Download original image
SED fitting on Alba’s tidal features. The measured SEDs and fitted spectra of the left and right panels show the inputs and outputs of CIGALE for both J-PAS and SDSS. They correspond to the named polygons of Fig. 1 with the same color. Circles show fluxes from 56 narrow/medium-band J-PAS filters, while triangles represent SDSS’s five broad filters. Fitted CIGALE spectra are overlaid using gray (SDSS) and colored (J-PAS) lines. The residuals between the SED fitting results of both surveys and their respective observed fluxes are presented in Appendix. A (Fig. A.1). The dataset underlying this plot is publicly accessible through Zenodo (see Appendix E.4).
Current usage metrics show cumulative count of Article Views (full-text article views including HTML views, PDF and ePub downloads, according to the available data) and Abstracts Views on Vision4Press platform.
Data correspond to usage on the plateform after 2015. The current usage metrics is available 48-96 hours after online publication and is updated daily on week days.
Initial download of the metrics may take a while.