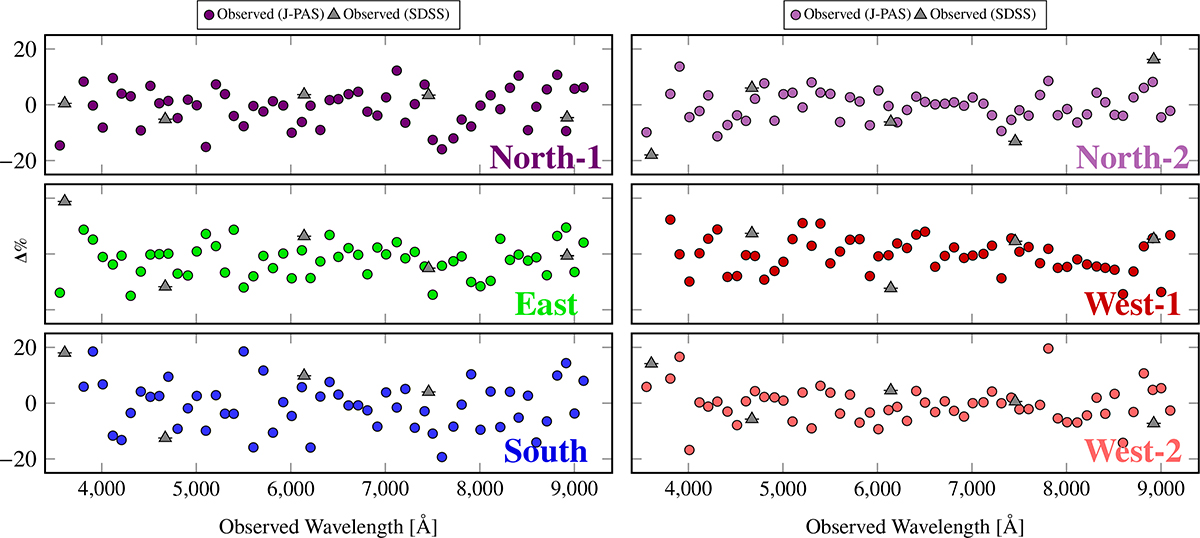
Fig. A.1.
Download original image
Residuals between the SED fitting results from J-PAS and SDSS surveys and their corresponding observed fluxes. The circles represent the residuals associated with the J-PAS data, while the triangles indicate those derived from SDSS. The color coding of the J-PAS data matches that of the polygons shown in Fig. 1, ensuring consistency across the figures and facilitating visual comparison. The data used to generate these residual plots are available on Zenodo; further details can be found in Appendix E.7.
Current usage metrics show cumulative count of Article Views (full-text article views including HTML views, PDF and ePub downloads, according to the available data) and Abstracts Views on Vision4Press platform.
Data correspond to usage on the plateform after 2015. The current usage metrics is available 48-96 hours after online publication and is updated daily on week days.
Initial download of the metrics may take a while.