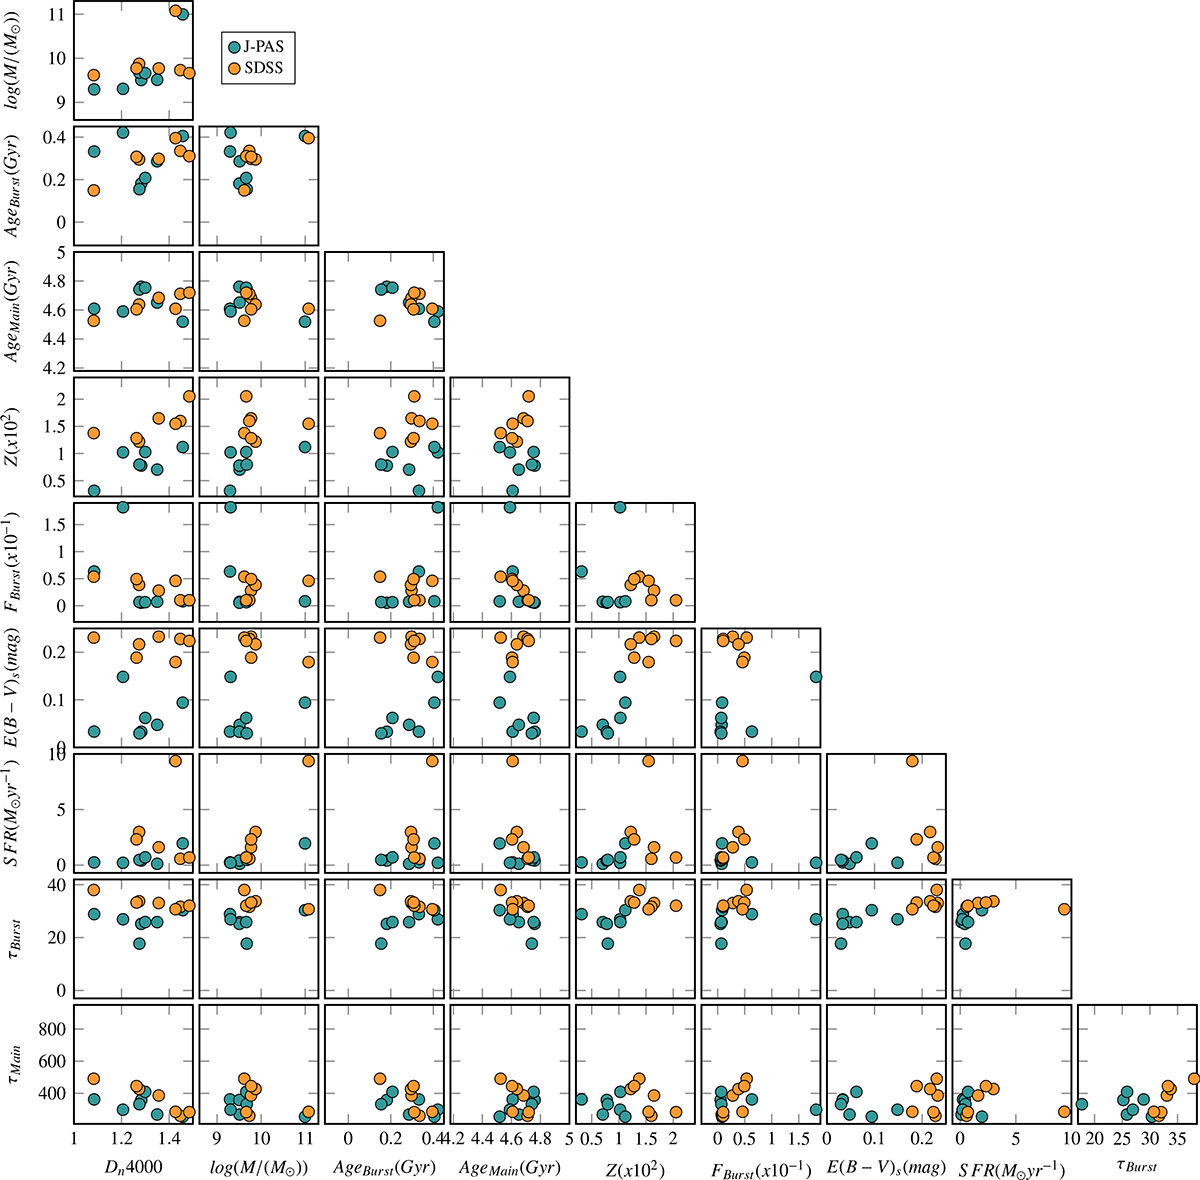
Fig. C.1.
Download original image
Corner plot of CIGALE output properties for J-PAS (in cyan) and SDSS data (in orange). In this run, the Salpeter (1955) IMF was used, and the main grid parameters modified in CIGALE were the same as those described in Appendix B. This step was taken because it is essential to ensure that the IMF applied in the CIGALE fitting is consistent with the IMF assumed in the M/L relations adopted by B03. The data used to generate this figure are available on Zenodo (see Appendix E.8).
Current usage metrics show cumulative count of Article Views (full-text article views including HTML views, PDF and ePub downloads, according to the available data) and Abstracts Views on Vision4Press platform.
Data correspond to usage on the plateform after 2015. The current usage metrics is available 48-96 hours after online publication and is updated daily on week days.
Initial download of the metrics may take a while.