Fig. 2
Download original image
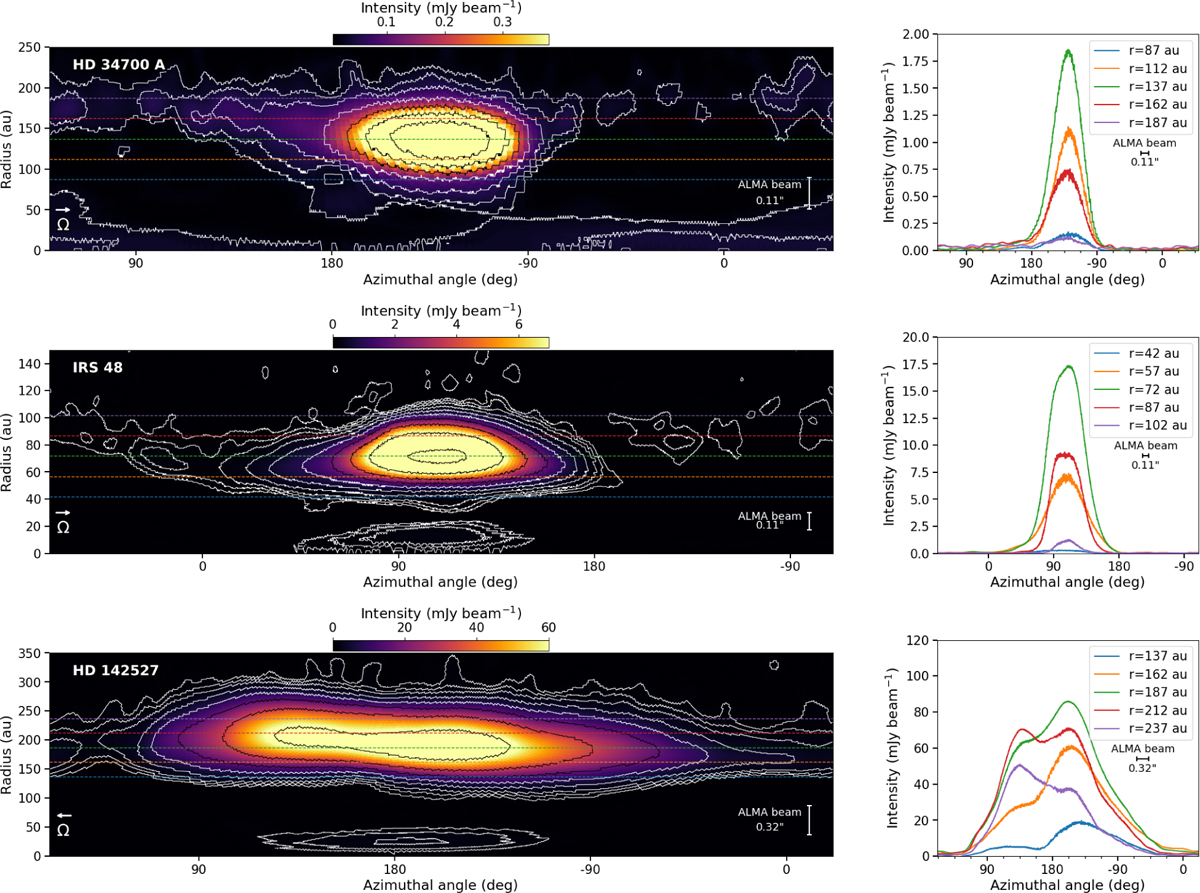
Left column: de-projected continuum images of HD 34700A (top), IRS 48 (middle), and HD 142527 (bottom) in polar coordinates. Contours are the same as in Figure 1. In the bottom left corner we show the rotation direction of the gas, while in the bottom right corner we show the beam size in the radial direction. Right column: azimuthal profiles of the de-projected continuum images from the left column, taken at different radii around the peak location, corresponding to the dashed lines with the same colours in the left column. We use the savgol_filter function of the scipy (Virtanen et al. 2020) module to smooth the oscillations introduced by the interpolation on the polar grid. We also show the ALMA beam size associated to the azimuthal profile evaluated at the peak radius. The plots have been shifted azimuthally so that the image peak is in the centre and the −180° azimuth coincide with the 180° azimuth.
Current usage metrics show cumulative count of Article Views (full-text article views including HTML views, PDF and ePub downloads, according to the available data) and Abstracts Views on Vision4Press platform.
Data correspond to usage on the plateform after 2015. The current usage metrics is available 48-96 hours after online publication and is updated daily on week days.
Initial download of the metrics may take a while.