| Issue |
A&A
Volume 709, May 2026
|
|
|---|---|---|
| Article Number | A174 | |
| Number of page(s) | 13 | |
| Section | Planets, planetary systems, and small bodies | |
| DOI | https://doi.org/10.1051/0004-6361/202558212 | |
| Published online | 13 May 2026 | |
The circumbinary disc of HD 34700A
II. Analysis of a strong dust asymmetry
1
Université Côte d’Azur, Observatoire de la Côte d’Azur, CNRS, Laboratoire Lagrange,
Nice,
France
2
Max-Planck-Institut für Astronomie,
Königstuhl 17,
69117
Heidelberg,
Germany
3
European Southern Observatory,
Karl-Schwarzschild-Str. 2,
85748
Garching bei München,
Germany
4
Astronomy Unit, School of Physics and Astronomy, Queen Mary University of London,
London
E1 4NS,
UK
5
Department of Astronomy, University of Florida,
Gainesville,
FL
32611,
USA
6
Dipartimento di Fisica, Università degli Studi di Milano,
Via Celoria 16,
Milano,
Italy
7
Department of Earth, Atmospheric, and Planetary Sciences, Massachusetts Institute of Technology,
Cambridge,
MA
02139,
USA
8
Ludwig-Maximilians-Universität München, Universitäts-Sternwarte,
Scheinerstr. 1,
81679
München,
Germany
★ Corresponding author: This email address is being protected from spambots. You need JavaScript enabled to view it.
Received:
21
November
2025
Accepted:
25
March
2026
Abstract
Context. ALMA observations have shown that substructures are ubiquitous in protoplanetary discs. A sub-group, the transition discs, shows large cavities and rings in the dust continuum. Among these, some present very high contrast asymmetries possibly due to the presence of vortices. HD 34700A is a binary system featuring a cavity, a ring, and multiple spiral arms detected in scattered light, a prominent crescent in the ALMA continuum, and a complex gas morphology possibly connected with ongoing infall.
Aims. We present new ALMA band 6 (1.3 mm) continuum images of the circumbinary disc around HD 34700A and compare them with two other systems showcasing high (≳30, measured as the peak-to-azimuthal-average ratio) contrast continuum asymmetries, IRS 48 and HD 142527. We aim to characterise the crescent morphology, discuss their possible origin, and, in the case of the vortex scenario, assess the efficiency of dust trapping in these systems.
Methods. We performed visibility modelling of the new high-resolution (0⋅′′11 × 0⋅′′09) ALMA band 6 continuum data of HD 34700A, together with improved visibility modelling of the other two targets.
Results. We detected a 0⋅′′46 (161 au) large cavity and resolved a ring with an asymmetric crescent and an extended tail at 0⋅′′53 (186 au) with a peak intensity of 1.9 mJybeam−1, corresponding to the second highest contrast (~62) ever detected with ALMA in a protoplanetary disc. We also detected unresolved emission inside the cavity, which we attribute to an inner disc. Our visibility model is in remarkable agreement with the HD 34700A data, featuring only localised residuals in the region of the disc corresponding to the tail of the asymmetry. For HD 142527, we obtained very good overall agreement with the data, recovering both the double peaked asymmetric ring and the inner disc emission. In the case of IRS 48, we recovered the general morphology of the asymmetry, but we could not reproduce the fainter ring. We then ran a hydrodynamic model of a vortex with different dust fluids, reproducing the general morphology observed in the HD 34700A and IRS 48 systems, with the emission around the vortex showing a mild asymmetry between the leading and trailing sides.
Conclusions. With a combination of visibility, dust evolution, and hydrodynamical models, we have constrained the morphology of the dust continuum emission of HD 34700A for the first time, and improved existing models for IRS 48 and HD 142527. The high azimuthal contrast of the asymmetries rules out the orbit clustering of eccentric cavities scenario, while the dust evolution models we consider suggest that the vortex scenario is a plausible option.
Key words: planets and satellites: formation / protoplanetary disks / planet-disk interactions
© The Authors 2026
 Open Access article, published by EDP Sciences, under the terms of the Creative Commons Attribution License (https://creativecommons.org/licenses/by/4.0), which permits unrestricted use, distribution, and reproduction in any medium, provided the original work is properly cited.
This article is published in open access under the Subscribe to Open model. This email address is being protected from spambots. You need JavaScript enabled to view it. to support open access publication.
1 Introduction
High spatial resolution observations from the Atacama Large Millimeter/submillimeter Array (ALMA) have shown a variety of substructures in the continuum emission of protoplanetary discs, such as rings, gaps, and cavities (Andrews et al. 2018; Long et al. 2018; Andrews 2020; Bae et al. 2023). Systems featuring large cavities in the dust emission are typically labelled as transition discs (Strom et al. 1989; Espaillat et al. 2014). Kinematic analysis of molecular line emission shows the presence of cavities also in the gas in many transition discs (van der Marel et al. 2016b; Boehler et al. 2017; Dong et al. 2017), as well as a more complex morphology showing spiral arms and localised deviations from Keplerian rotation (Wölfer et al. 2023; Izquierdo et al. 2025).
A systematic study of asymmetric transition discs was conducted by van der Marel et al. (2021). More recently, similar continuum asymmetries have also been detected in debris discs, suggesting that they might also be common in the later stages of protoplanetary discs (Marino et al. 2026; Lovell et al. 2026). These systems are of particular interest as the asymmetric emission is thought to be caused by physical processes that promote azimuthal trapping of dust grains (Birnstiel et al. 2013; Pinilla et al. 2012), and they could potentially provide favourable conditions for the formation of planetesimals (Barge & Sommeria 1995; Surville et al. 2016; Surville & Mayer 2019). Azimuthal dust trapping is primarily caused by the presence of a pressure maximum, with two possible mechanisms at its origin: anti-cyclonic vortices triggered by the Rossby wave instability (RWI), (Lovelace et al. 1999; Li et al. 2000; Lyra & Lin 2013; Baruteau & Zhu 2016) or gas horseshoes induced by eccentric cavities due to binary companions (Shi et al. 2012; Ragusa et al. 2017; Miranda et al. 2017). The RWI requires a narrow dip in the vortensity radial profile, which can occur in the presence of strong density (de Val-Borro et al. 2007) or viscosity gradients (Regály et al. 2012), typically at the edge of gas rings and cavities, and it can be triggered by infalling material on the disc (Bae et al. 2015). It also requires low viscosity (α ≲ 10−3 Shakura & Sunyaev 1973; Zhu & Stone 2014) to produce long-lived vortices. On the other hand, gas horseshoes only need a massive binary companion (with a mass ratio of q > 0.05) and are not limited by the disc viscosity (Ragusa et al. 2017, 2020). Both mechanisms produce a gas azimuthal overdensity of a factor ≲2–4, orbiting at Keplerian velocity, and trap millimetre dust grains both radially and azimuthally (Birnstiel et al. 2013), resulting in an azimuthal dust contrast, defined as the ratio between the peak intensity and the azimuthal average of the ring emission1, of up to a few hundred.
Another possible origin for continuum asymmetries is the presence of an eccentricity gradient in the disc (Ataiee et al. 2013), where the eccentric orbits of dust and gas particles cluster along the gradient direction, which is typically the apocentre for eccentric cavities in transition discs (Ragusa et al. 2024). In this scenario the overdensity remains fixed at the apocentre of the orbit, hence it does not rotate with Keplerian motion around the central star. As the overdensity is a consequence of the orbits clustering and the eccentricity gradient of the disc, it also does not create azimuthal pressure variations and does not trap dust, achieving only a moderate azimuthal contrast of ≲5 (Ataiee et al. 2013).
Differentiating between these scenarios as the cause of the observed asymmetries has been a challenging endeavour. The disc turbulence, which governs if vortices can be excited, is poorly constrained (Flaherty et al. 2020; Rosotti 2023). As a result, observations achieving an angular resolution higher than ![Mathematical equation: $\[0^{\prime\prime}_\cdot1\]$](/articles/aa/full_html/2026/05/aa58212-25/aa58212-25-eq4.png) and a spectral resolution of ~100 ms−1 (e.g. Robert et al. 2020; Huang et al. 2018) are needed to detect the characteristic gas signature associated with vortices and to disentangle the origin of the dust asymmetries, although beam-smearing effects can produce similar patterns (Boehler et al. 2021). van der Marel et al. (2021) studied a sample of asymmetric transition discs, but could not rule out either process. Recently, Wölfer et al. (2025) constructed an analytical vortex model and performed hydrodynamic simulations to study four discs with azimuthal dust asymmetries from the exoALMA sample (Teague et al. 2025), finding no unambiguous link between the kinematical patterns of the data and the continuum crescents, likely due to the complex underlying kinematical field.
and a spectral resolution of ~100 ms−1 (e.g. Robert et al. 2020; Huang et al. 2018) are needed to detect the characteristic gas signature associated with vortices and to disentangle the origin of the dust asymmetries, although beam-smearing effects can produce similar patterns (Boehler et al. 2021). van der Marel et al. (2021) studied a sample of asymmetric transition discs, but could not rule out either process. Recently, Wölfer et al. (2025) constructed an analytical vortex model and performed hydrodynamic simulations to study four discs with azimuthal dust asymmetries from the exoALMA sample (Teague et al. 2025), finding no unambiguous link between the kinematical patterns of the data and the continuum crescents, likely due to the complex underlying kinematical field.
In this paper, we present recent ALMA observations of the system HD 34700 AaAb (hereafter HD 34700 A), which resolved a prominent dust asymmetry co-located with a tentative kinematic vortex signature (Stadler et al. 2026). We focus on the continuum data of HD 34700A and, for this study, we performed visibility modelling of the new ALMA Band 6 observations, comparing it with the transition discs with the most prominent asymmetries (with a contrast ≳30) from the van der Marel et al. (2021) sample, namely Oph-IRS 48 (IRS 48 hereafter) and HD 142527. This paper is organised with the following structure: in Sect. 2 we present the observations used in our analysis, while in Sect. 3 we introduce the methods adopted to model the data. In Sect. 4 we present the results of our visibility modelling and discuss them in Sect. 5; we summarise our findings in Sect. 6.
2 Observations
2.1 Sources
HD 34700A: HD 34700A is a near-equal-mass (Mbin = 4 M⊙) close (abin = 0.69 au) Herbig Ae spectroscopic binary, belonging to the quadruple system HD 34700 (d ≈ 351 pc Gaia Collaboration 2023; Sterzik et al. 2005). The two young (~5 Myr) stars have stellar radii of R1 = 3.46 R⊙ and R2 = 3.40 R⊙ (Monnier et al. 2019), and effective temperatures of Teff,1 = 5900 K and Teff,1 = 5800 K (Torres 2004). Monnier et al. (2019) resolved the circumbinary disc around HD 34700A for the first time using Gemini Planet Imager (GPI) band K and H polarised scattered light images, unveiling an elliptical ring at 175 au with an inclination i = 42° and a Position Angle (PA) of 42°, a dust depleted cavity, multiple spiral arms, and a discontinuity towards the northern side of the disc, later confirmed by Uyama et al. (2020) with Subaru/SCExAO and Columba et al. (2024) using SPHERE/IRDIS (H and K bands) and SPHERE/IFS (YJH bands). Additionally, Columba et al. (2024) detected a symmetric ring with inclination i = 39.7 ± 2° and PA = 87.1 ± 1.2° in SPHERE/ZIMPOL H α scatter light observations, inside the infrared (IR) ring, at 65–120 au. Benac et al. (2020) imaged the 1.13 mm continuum, 12CO and 13CO J = 2 − 1 emission with a resolution of ![Mathematical equation: $\[0^{\prime\prime}_\cdot5\]$](/articles/aa/full_html/2026/05/aa58212-25/aa58212-25-eq5.png) using the Submillimeter Array (SMA), resolving a prominent dust asymmetry at
using the Submillimeter Array (SMA), resolving a prominent dust asymmetry at ![Mathematical equation: $\[155_{-7}^{+11}\]$](/articles/aa/full_html/2026/05/aa58212-25/aa58212-25-eq6.png) au with radial width of
au with radial width of ![Mathematical equation: $\[72_{-15}^{+14}\]$](/articles/aa/full_html/2026/05/aa58212-25/aa58212-25-eq7.png) au and azimuthal width
au and azimuthal width ![Mathematical equation: $\[64_{-7}^{+8}\]$](/articles/aa/full_html/2026/05/aa58212-25/aa58212-25-eq8.png) deg, and a circumbinary disc rotating counter-clockwise.
deg, and a circumbinary disc rotating counter-clockwise.
Recent ALMA band 6 observations (λ = 1.3 mm, ![Mathematical equation: $\[0^{\prime\prime}_\cdot11\]$](/articles/aa/full_html/2026/05/aa58212-25/aa58212-25-eq9.png) resolution), (Stadler et al. 2026) resolved for the first time the ring co-orbital with the previously detected asymmetry, a dust depleted cavity and emission from the inner region in the continuum. We describe the dust morphology in detail in Sect. 4. Stadler et al. (2026) also performed kinematic analysis of the 12CO, 13CO and C18O J = 2 − 1 molecular lines, tracing a
resolution), (Stadler et al. 2026) resolved for the first time the ring co-orbital with the previously detected asymmetry, a dust depleted cavity and emission from the inner region in the continuum. We describe the dust morphology in detail in Sect. 4. Stadler et al. (2026) also performed kinematic analysis of the 12CO, 13CO and C18O J = 2 − 1 molecular lines, tracing a ![Mathematical equation: $\[0^{\prime\prime}_\cdot20\]$](/articles/aa/full_html/2026/05/aa58212-25/aa58212-25-eq10.png) (≈65 au) inner cavity in the peak intensity maps of all the isotopologues, strong deviations from Keplerian rotation in the 12CO emission in the shape of spiral spurs following the IR spiral ring, and less pronounced residuals in the 13CO and C18O velocity maps resembling the kinematic signature of a vortex (Wölfer et al. 2025).
(≈65 au) inner cavity in the peak intensity maps of all the isotopologues, strong deviations from Keplerian rotation in the 12CO emission in the shape of spiral spurs following the IR spiral ring, and less pronounced residuals in the 13CO and C18O velocity maps resembling the kinematic signature of a vortex (Wölfer et al. 2025).
IRS 48: IRS 48 is a ~2.5 M⊙, ~4 Myr old Herbig A0 star (Teff ≈ 9000 K; Brown et al. 2012; Schworer et al. 2017; Francis & van der Marel 2020), at a distance of d ≈ 135 pc (Gaia Collaboration 2023). ALMA band 7 observations of 12CO and 13CO have shown a gas disc with inclination i = 50° and PA = 100° and a 20–30 au gas cavity (Bruderer et al. 2014; van der Marel et al. 2016a). The continuum emission features an eccentric ring (e = 0.27) with a semi-major axis of 78 au and the most prominent asymmetry observed at sub-mm wavelengths (with a contrast of ≳270) (Yang et al. 2023), interpreted as a dust trap (van der Marel et al. 2013, 2015). The asymmetry shows a tail spanning ~180° from the peak emission to the opposite side of the ring, which trails behind the overdensity, as the disc rotates counter-clockwise (Bruderer et al. 2014). Using polarimetric ALMA data, Yang et al. (2024) attributed the asymmetric overdensity to a vortex with moderate dust settling and an effective turbulence parameter α = 10−4−5 × 10⁻³.
HD 142527: HD 142527 is a binary system comprising a ~1.69 M⊙ F6 star, with an age of ~8 Myr, stellar radius of R ≈ 2.2 au and temperature of ~6500 K (Fairlamb et al. 2015; Francis & van der Marel 2020), and a ~0.1 M⊙ M dwarf companion (Teff = 2600–2800 K, R ≈ 0.9 R⊙; Lacour et al. 2016; Claudi et al. 2019) on an eccentric (e ≳ 0.2) and non coplanar orbit, at separations of ~44–90 mas (~15 au; Biller et al. 2012; Nowak et al. 2024) and a distance of d ≈ 157 pc (Gaia Collaboration 2023). The binary orbit is too compact to explain the large cavity, suggesting the presence of a planet shaping the disc substructures (Nowak et al. 2024). Recent MATISSE observations have shown that the circumstellar disc around HD 142527A features a complex, asymmetric geometry, possibly associated with the interactions with the companion star (Scheuck et al. 2026). The stars are surrounded by a circumbinary disc rotating clockwise with inclination i = 27° (Fukagawa et al. 2013; van der Marel et al. 2021) and a position angle PA = 160°. A double peaked asymmetry at a radial location of ~166 au has been observed in the ALMA band 7 continuum, with a contrast of ≳50 (Casassus et al. 2013; Boehler et al. 2017). The 12CO and C18O ALMA line emission have shown a gas cavity of 50 au, wherein a misaligned inner disc (i = 23°, PA = 14° Marino et al. 2015; Bohn et al. 2022) casts shadows on the outer disc (Boehler et al. 2017). Performing kinematic analysis of these molecules, Boehler et al. (2021) found deviations of 350 ms−1 from the Keplerian rotation of the disc, co-located with the dust crescents, and suggesting that this could be caused by a vortex with an aspect ratio of 5, centred at the secondary peak of the dust continuum. Additionally, Temmink et al. (2023) analysed multiple molecules in this system, observing an asymmetric molecular emission in HCN and CS, peaking at the opposite side of the disc with respect to the continuum crescent. They infer that this asymmetry is likely due to continuum over-subtraction for the main CO isotopologues, and propose that it can be the result of shadowing from the misaligned inner disc for the CS and HCN molecules.
2.2 Data
In this work, we consider ALMA band 6 continuum data of the system HD 34700A (2022.1.00760.S; PI: J. Stadler), ALMA band 7 (0.87 mm) continuum observations of the disc IRS 48 (2019.1.01059.S; PI: H. Yang) and ALMA band 7 continuum data of the system HD 142527 (2013.1.00305.S; PI: S. Casassus). The self-calibration strategy for the HD 34700 A, IRS 48, and HD 142527 datasets are described in Stadler et al. (2026); Yang et al. (2023); Temmink et al. (2023).
The HD 34700 data consists of two short baseline (SB) and 11 long baseline (LB) execution blocks (EBs). The SB data were taken on October 9, 2022, in configuration C-3 (maximum baseline Lmax = 500 m) and with a mean Precipitable Water Vapour (PWV) of 0.3 mm. The LB data were taken in configuration C-6 (Lmax = 2.5 km) over a period of three weeks, on May 13, 19, 21, 24, 28, 30, and June 2, 2023, using a number of antennas between 42 and 44 and with a mean PWV in the range 0.3–1.4 mm. The spectral setup was chosen to study the kinematics of the system, thus only two spectral windows (SPWs) are dedicated to the continuum emission centred at 218.0 and 232.6 GHz with the maximum bandwidth of 1.9 GHz. In this paper, we focus on visibility modelling the continuum emission of HD 34700 A. However, the HD 34700 ALMA data set incorporates emission not only from the circumbinary disc A, but also from the low-mass companion B in the same field-of-view (Stadler et al. 2026). We first start by removing the contribution from the secondary from the visibility table. To do so, we create a CLEAN model of HD 34700 B CLEANing down to 5μJy/beam (≈1σ) within an elliptic CLEAN mask of ![Mathematical equation: $\[R=0^{\prime\prime}_\cdot625\]$](/articles/aa/full_html/2026/05/aa58212-25/aa58212-25-eq11.png) (i = 41.5) centred around B. We then remove the tclean model visibility from the data set using the uvsub() task of CASA (CASA Team et al. 2022) to obtain the final measurement set used in this work. The phase centre of the dataset is (
(i = 41.5) centred around B. We then remove the tclean model visibility from the data set using the uvsub() task of CASA (CASA Team et al. 2022) to obtain the final measurement set used in this work. The phase centre of the dataset is (![Mathematical equation: $\[05^{\mathrm{h}} 19^{\mathrm{m}} 41^{\mathrm{s}}.4115,05^{\circ} 38^{\prime} 42^{\prime \prime}_\cdot7931\]$](/articles/aa/full_html/2026/05/aa58212-25/aa58212-25-eq12.png) ).
).
The IRS 48 observations consists of six EBs in two different array configurations, C43-6 and C43-7, and were conducted on 2021 June 7, June 14, and July 19 with a mean PWV in the range 0.6–0.9 mm. As the observations were aimed at measuring the dust polarisation, all the SPWs were dedicated to the continuum emission, centred at 336.5, 338.4, 348.5, and 350.5 GHz, with a nominal bandwidth of 2.0 GHz. The reported phase centre is (![Mathematical equation: $\[16^{\mathrm{h}} 27^{\mathrm{m}} 37^{\mathrm{s}}.1700,-24^{\circ} 30^{\prime} 35^{\prime \prime}_\cdot6710\]$](/articles/aa/full_html/2026/05/aa58212-25/aa58212-25-eq13.png) ).
).
The HD 142527 data consists of two EBs in two different array configurations, C43-5 and C35-5. The observations were conducted on August 11 and 30, 2015, with a PWV of 1.6 mm and only one spw dedicated to the continuum emission, centred at 277 GHz with a nominal bandwidth of 2.0 GHz. The reported phase centre is (![Mathematical equation: $\[15^{\mathrm{h}} 56^{\mathrm{m}} 41^{\mathrm{s}}.8741,-42^{\circ} 19^{\prime} 23^{\prime \prime}_\cdot6564\]$](/articles/aa/full_html/2026/05/aa58212-25/aa58212-25-eq14.png) ).
).
2.3 Imaging
We image the continuum data using the tclean() task of the CASA software (CASA Team et al. 2022), version 6.6.5-31. We define elliptic masks with semi-major axis of ![Mathematical equation: $\[1^{\prime\prime}_\cdot2, 1^{\prime\prime}_\cdot0, 2^{\prime\prime}_\cdot2\]$](/articles/aa/full_html/2026/05/aa58212-25/aa58212-25-eq15.png) and inclination of 35°, 51°, 29° for HD 34700 A, IRS 48, and HD 142527, respectively, and CLEAN the images down to 3σ using a robust parameter of 0.0, chosen to provide the best balance between resolution and sensitivity. We produce a 2000 × 2000 pixels image with pixel size of
and inclination of 35°, 51°, 29° for HD 34700 A, IRS 48, and HD 142527, respectively, and CLEAN the images down to 3σ using a robust parameter of 0.0, chosen to provide the best balance between resolution and sensitivity. We produce a 2000 × 2000 pixels image with pixel size of ![Mathematical equation: $\[0^{\prime\prime}_\cdot015\]$](/articles/aa/full_html/2026/05/aa58212-25/aa58212-25-eq16.png) for HD 34700 A, a 1024 × 1024 pixels image with pixel size of
for HD 34700 A, a 1024 × 1024 pixels image with pixel size of ![Mathematical equation: $\[0^{\prime\prime}_\cdot009\]$](/articles/aa/full_html/2026/05/aa58212-25/aa58212-25-eq17.png) for IRS 48, and a 1024 × 1024 pixels image with pixel size of
for IRS 48, and a 1024 × 1024 pixels image with pixel size of ![Mathematical equation: $\[0^{\prime\prime}_\cdot025\]$](/articles/aa/full_html/2026/05/aa58212-25/aa58212-25-eq18.png) for HD 142527. We use the gofish package (Teague 2019) to compute the Root Mean Square (RMS) noise in annulus between
for HD 142527. We use the gofish package (Teague 2019) to compute the Root Mean Square (RMS) noise in annulus between ![Mathematical equation: $\[2^{\prime\prime}_\cdot5{-}4\]$](/articles/aa/full_html/2026/05/aa58212-25/aa58212-25-eq19.png) for HD 34700A and IRS 48, and between 3″–4″ for HD 142527. The final images are shown in Figure 1, while their properties are summarised in Table 1.
for HD 34700A and IRS 48, and between 3″–4″ for HD 142527. The final images are shown in Figure 1, while their properties are summarised in Table 1.
3 Methods
We model the continuum emission of the new HD 34700A data in order to constrain the morphological properties of the crescent and ring. van der Marel et al. (2021) already fitted the visibilities of the ALMA data for the systems IRS 48 and HD 142527, assuming a simple 2D arc to model the asymmetric rings. However, recent observations of IRS 48 also resolve a ring, while a single arc could not fully describe the double peaked emission of HD 142527, as shown by their intensity residuals of up to 40%. As a result, in this work we perform visibility fitting for the new data of HD 34700A as well as the IRS 48 and HD 142527 data, using an improved model.
We use the code galario (Tazzari et al. 2018) to fit the visibility data and characterise the morphological structure of the continuum emission. We assume a 2D parametric intensity model and follow a Markov chain Monte Carlo (MCMC) approach implemented with the package emcee (Foreman-Mackey et al. 2013). With this procedure, we can constrain both the morphological parameters specific to the chosen model, as well as the geometrical parameters of the outer disc, namely the inclination i, the position angle PA and the offsets (ΔRA, ΔDec) between the disc and the phase centres.
We define three models for the brightness distribution
![Mathematical equation: $\[\begin{aligned}I_{\mathrm{HD} ~34700 \mathrm{~A}}(r, \theta)= & G(f_0, \sigma_0)+G R(f_1, r_1, \sigma_{r, 1}) \\& +G A a(f_1^{\mathrm{a}}, r_1^{\mathrm{a}}, \sigma_{r, 1}^{\mathrm{a}}, \theta_1^{\mathrm{a}}, \sigma_{\theta, 11}^{\mathrm{a}}, \sigma_{\theta, \mathrm{r} 1}^{\mathrm{a}}),\end{aligned}\]$](/articles/aa/full_html/2026/05/aa58212-25/aa58212-25-eq32.png) (1)
(1)
![Mathematical equation: $\[\begin{aligned}I_{\operatorname{IRS} 48}(r, \theta)= & G R(f_1, r_1, \sigma_{r, 1}) \\& +G A a(f_1^{\mathrm{a}}, r_1^{\mathrm{a}}, \sigma_{r, 1}^{\mathrm{a}}, \theta_1^{\mathrm{a}}, \sigma_{\theta, 11}^{\mathrm{a}}, \sigma_{\theta, \mathrm{r} 1}^{\mathrm{a}}),\end{aligned}\]$](/articles/aa/full_html/2026/05/aa58212-25/aa58212-25-eq33.png) (2)
(2)
![Mathematical equation: $\[\begin{aligned}I_{\mathrm{HD} ~142527}(r, \theta)= & G o(f_0, x_0, y_0, \sigma_0)+G R(f_1, r_1, \sigma_{r, 1}) \\& +\sum_{i=1}^2 G A a(f_i^{\mathrm{a}}, r_i^{\mathrm{a}}, \sigma_{r, i}^{\mathrm{a}}, \theta_i^{\mathrm{a}}, \sigma_{\theta, l i}^{\mathrm{a}}, \sigma_{\theta, r i}^{\mathrm{a}}),\end{aligned}\]$](/articles/aa/full_html/2026/05/aa58212-25/aa58212-25-eq34.png) (3)
(3)
where G(f, σ) is a Gaussian aligned to the image centre with radial width σ and peak flux f, Go(f, x, y, σ) is an offset Gaussian centred in the (x, y) coordinates, GR(f, r, σ) is an axisymmetric Gaussian ring centred in r with radial width σ and peak flux f, while GAa(f, r, σr, θ, σθ,1, σθ,r) is a Gaussian asymmetric arc centred in (r, θ) with radial width σr, azimuthal widths σθ,1 and σθ,r, and peak flux f. The models for HD 34700 A, IRS 48, and HD 142527 have a total of 15, 13, and 23 parameters, respectively. We use the Gaussian to describe the emission originating inside the cavity, the Gaussian ring, and the Gaussian arcs to model the asymmetric ring, choosing one arc for the single peaked emission of HD 34700A and IRS 48, and two arcs for the double peaked morphology of HD 142527. We use asymmetric arcs with different azimuthal widths on the left (σθ,1) and right (σθ,r) of the peak intensity to better reproduce the tail observed in the continuum images. We choose to fix the inner Gaussian to the image centre for the HD 34700A model due to its proximity to the ring asymmetry, as the inner Gaussian would merge with the ring otherwise. We check that fixing the Gaussian in the centre does not affect the remaining parameters of the model, as they remain within 1σ error bars when the Gaussian is not fixed in the centre. In the case of IRS 48, adding a Gaussian component to the model does not recover the emission from the inner disc. This might be caused by the extreme intensity contrast of the asymmetric emission. As a result, we choose not to use a Gaussian component in the model of IRS 48.
We perform a preliminary exploration of the parameter space with emcee using uniform priors, sampling f0, f1, ![Mathematical equation: $\[f_{1}^{a}\]$](/articles/aa/full_html/2026/05/aa58212-25/aa58212-25-eq35.png) , and
, and ![Mathematical equation: $\[f_{2}^{a}\]$](/articles/aa/full_html/2026/05/aa58212-25/aa58212-25-eq36.png) logarithmically and the remaining parameters linearly. As initial step we use 100 walkers over ~103 steps. We then associate the best fit parameters as the median of the posterior distribution from this preliminary exploration, and set them as initial guesses for the fiducial emcee run. For each dataset we set up 120 walkers and 2 × 10⁴ steps, and discard the first 25% steps as burn-in. We report the geometrical parameters (i, PA, ΔRA, and ΔDec) in Table 1, while the full set of best fit parameters is shown in Table B.1, with the adopted priors reported in Appendix B. For the inclination and PA of HD 34700 A, we consider narrow priors around the values resulting from the 13CO discminer (Izquierdo et al. 2021) fit in Stadler et al. (2026) to help achieve convergence, and be consistent with their analysis. We use the same procedure for IRS 48, using the inclination and PA reported in Yang et al. (2023). For HD 142527, instead, we setup wider priors around the inclination and PA reported in van der Marel et al. (2021). We then evaluate the best fit galario model sampling the visibility plane at the same uv points of the observations, obtaining synthetic visibilities for the model, and subtract them from the observed visibilities in order to obtain the residuals. We then image the best fit galario model and the residuals using the same procedure explained in Sect. 2.3.
logarithmically and the remaining parameters linearly. As initial step we use 100 walkers over ~103 steps. We then associate the best fit parameters as the median of the posterior distribution from this preliminary exploration, and set them as initial guesses for the fiducial emcee run. For each dataset we set up 120 walkers and 2 × 10⁴ steps, and discard the first 25% steps as burn-in. We report the geometrical parameters (i, PA, ΔRA, and ΔDec) in Table 1, while the full set of best fit parameters is shown in Table B.1, with the adopted priors reported in Appendix B. For the inclination and PA of HD 34700 A, we consider narrow priors around the values resulting from the 13CO discminer (Izquierdo et al. 2021) fit in Stadler et al. (2026) to help achieve convergence, and be consistent with their analysis. We use the same procedure for IRS 48, using the inclination and PA reported in Yang et al. (2023). For HD 142527, instead, we setup wider priors around the inclination and PA reported in van der Marel et al. (2021). We then evaluate the best fit galario model sampling the visibility plane at the same uv points of the observations, obtaining synthetic visibilities for the model, and subtract them from the observed visibilities in order to obtain the residuals. We then image the best fit galario model and the residuals using the same procedure explained in Sect. 2.3.
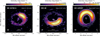 |
Fig. 1 Continuum images of HD 34700A (left), IRS 48 (middle), and HD 142527 (right). The white and black contours are taken at 3σ, 5σ, and 2nσ, with integer numbers n ≥ 3. The white plus sign marks the centre of the ring in the galario model, the ellipse in the bottom left corner represents the synthesised beam and the arrow in the bottom right corner shows the direction of the gas rotation. We apply an asinh stretch from {0.007, 0.007, 0.000} mJybeam−1 to a factor {0.2, 0.4, 0.7} of the peak intensity, using a stretch parameter of {0.1, 0.01, 0.1} to the colour scale to visually enhance the fainter emission. |
Disc continuum properties and geometrical parameters.
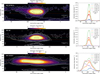 |
Fig. 2 Left column: de-projected continuum images of HD 34700A (top), IRS 48 (middle), and HD 142527 (bottom) in polar coordinates. Contours are the same as in Figure 1. In the bottom left corner we show the rotation direction of the gas, while in the bottom right corner we show the beam size in the radial direction. Right column: azimuthal profiles of the de-projected continuum images from the left column, taken at different radii around the peak location, corresponding to the dashed lines with the same colours in the left column. We use the savgol_filter function of the scipy (Virtanen et al. 2020) module to smooth the oscillations introduced by the interpolation on the polar grid. We also show the ALMA beam size associated to the azimuthal profile evaluated at the peak radius. The plots have been shifted azimuthally so that the image peak is in the centre and the −180° azimuth coincide with the 180° azimuth. |
4 Results
4.1 Continuum images
In Figure 1 we present the continuum image of the new ALMA band 6 data for HD 34700A and compare it with the continuum images of IRS 48 (Yang et al. 2023) and HD 142527 (Temmink et al. 2023). In Figure 2, we show the de-projected continuum images in polar coordinates (left panel) and azimuthal profiles at {87, 112, 137, 162, 187} au, {65, 80, 95, 110, 125} au and {137, 162, 187, 212, 237} au for HD 34700 A, IRS 48, HD 142527, respectively. We perform the de-projection using the package gofish, assuming the geometrical parameters from Table 1, and then interpolate the resulting image on a 501 × 2001 (R, θ) grid, with R ∈ [0, 4]″ and θ ∈ [−180, 180]°.
All systems feature an asymmetric overdensity with a tail trailing with respect to the disc rotation, and emission originating inside the dust depleted cavity. In Figure 1 we also show the centre of the ring in the galario model. We measure the peak intensity for all the images, estimating its uncertainty as the 10% ALMA flux calibration error for band 6 and 72. We define the contrast as the ratio between the peak intensity and the azimuthal average of the ring emission3, masking the asymmetry contribution when it becomes higher than 16σ, and report their values in Table 1. This corresponds to a peak intensity of 271σ, 1125σ, and 340σ and contrasts of 62, 259, and 37 for HD 34700 A, IRS 48, and HD 142527, respectively, making HD 34700A the disc with the second most prominent contrast in continuum emission observed with ALMA to date. For reference, we also report a contrast of 45,365, and 33 if defined as the ratio between the peak intensity and the emission at the opposite side of the disc (i.e. same radius and PA shifted by 180°).
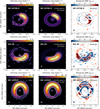 |
Fig. 3 Top to bottom: images of HD 34700 A, IRS 48, and HD 142527. Left to right: continuum images, same as in Figure 1; CLEANed galario model images; CLEANed residual images; In the left and middle columns, contours are the same as in Figure 1. In the right column, white solid (positive) and dashed (negative) contours start at 3σ and 5σ, and increase by 5σ, while black contours correspond to the 3σ emission from the CLEANed model. |
4.2 galario model and residuals
In Figure 3 we show the main results of the galario modelling of HD 34700A (top panels), IRS 48 (middle panels), and HD 142527 (bottom panels). The galario model for HD 34700A is in remarkable agreement with the data, with residuals of up to 7.4σ (~2.7% of the peak intensity) localised only in the region of the asymmetric tail. The final model consists of a central Gaussian with width of ![Mathematical equation: $\[{\sim} 0^{\prime\prime}_\cdot13\]$](/articles/aa/full_html/2026/05/aa58212-25/aa58212-25-eq37.png) (46 au), a ring centred in
(46 au), a ring centred in ![Mathematical equation: $\[{\sim} 0^{\prime\prime}_\cdot53\]$](/articles/aa/full_html/2026/05/aa58212-25/aa58212-25-eq38.png) (186 au) with radial width
(186 au) with radial width ![Mathematical equation: $\[{\sim} 0^{\prime\prime}_\cdot08\]$](/articles/aa/full_html/2026/05/aa58212-25/aa58212-25-eq39.png) (28 au) and an arc centred at (
(28 au) and an arc centred at (![Mathematical equation: $\[{\sim} 0^{\prime\prime}_\cdot39\]$](/articles/aa/full_html/2026/05/aa58212-25/aa58212-25-eq40.png) , 328°) (137 au) with radial width
, 328°) (137 au) with radial width ![Mathematical equation: $\[{\sim} 0^{\prime\prime}_\cdot03\]$](/articles/aa/full_html/2026/05/aa58212-25/aa58212-25-eq41.png) (11 au) and an azimuthal Full Width Half Maximum (FWHM) of 43.2°, which we computed as
(11 au) and an azimuthal Full Width Half Maximum (FWHM) of 43.2°, which we computed as ![Mathematical equation: $\[\sqrt{2 ~\ln~ 2}(\sigma_{\theta, 1}^{a}+\sigma_{\theta, \mathrm{r}}^{a})\]$](/articles/aa/full_html/2026/05/aa58212-25/aa58212-25-eq42.png) . Although we fixed the inner Gaussian to the disc centre, the model still reproduces the emission remarkably well, with residuals <3σ in the cavity. The ring prescription we use is too simple to reproduce the faint azimuthal variations observed in the data, overestimating the intensity in the north-eastern side of the ring (with residuals ≲3σ) and underestimating the tail contribution, implying that the tail structure is more complex than a simple Gaussian azimuthal dependence. Taking into account the improved resolution and S/N, our results are consistent with the SMA data presented in Benac et al. (2020), with their radial position, radial width, and azimuthal FWHM of the asymmetry being within 2σ of our model fit and new data.
. Although we fixed the inner Gaussian to the disc centre, the model still reproduces the emission remarkably well, with residuals <3σ in the cavity. The ring prescription we use is too simple to reproduce the faint azimuthal variations observed in the data, overestimating the intensity in the north-eastern side of the ring (with residuals ≲3σ) and underestimating the tail contribution, implying that the tail structure is more complex than a simple Gaussian azimuthal dependence. Taking into account the improved resolution and S/N, our results are consistent with the SMA data presented in Benac et al. (2020), with their radial position, radial width, and azimuthal FWHM of the asymmetry being within 2σ of our model fit and new data.
For IRS 48, the galario model reproduces the general morphology of the asymmetry, but fails to recover the ring emission. This is probably due to the extreme contrast of the crescent, which dominates the residuals, but can also be a consequence of the eccentric nature of the ring, which is not taken into account by our model. In the region of the asymmetry we measure residuals of up to 96σ and −152σ, which correspond to deviations of 8.6 and 13.5% of the peak emission, respectively. The final model consists of a ring centred in ![Mathematical equation: $\[{\sim} 0^{\prime\prime}_\cdot72\]$](/articles/aa/full_html/2026/05/aa58212-25/aa58212-25-eq43.png) (97 au) with radial width
(97 au) with radial width ![Mathematical equation: $\[{\sim} 0^{\prime\prime}_\cdot17\]$](/articles/aa/full_html/2026/05/aa58212-25/aa58212-25-eq44.png) (23 au), although too faint compared with the observations, and an arc centred at (
(23 au), although too faint compared with the observations, and an arc centred at (![Mathematical equation: $\[{\sim} 0^{\prime\prime}_\cdot42\]$](/articles/aa/full_html/2026/05/aa58212-25/aa58212-25-eq45.png) , 197°) (56 au) with radial width
, 197°) (56 au) with radial width ![Mathematical equation: $\[{\sim} 0^{\prime\prime}_\cdot07\]$](/articles/aa/full_html/2026/05/aa58212-25/aa58212-25-eq46.png) (9 au) and an FWHM of 79.0°. These values are consistent with the single arc model from van der Marel et al. (2021).
(9 au) and an FWHM of 79.0°. These values are consistent with the single arc model from van der Marel et al. (2021).
In the case of HD 142527, the galario model reproduces the general morphology observed in the data at a very good qualitative level, showing both the disc and the double peaked emission in the ring. However, strong residuals of up to 20.1σ are present all across the ring, although they represent deviations of only 6.2% when compared to the peak intensity, an improvement of more than a factor 6 compared to the previous model from van der Marel et al. (2021). The final model features a Gaussian with an offset of (94,−159) mas and a width of ![Mathematical equation: $\[{\sim} 0^{\prime\prime}_\cdot03\]$](/articles/aa/full_html/2026/05/aa58212-25/aa58212-25-eq47.png) , a very thin ring centred at
, a very thin ring centred at ![Mathematical equation: $\[{\sim} 1^{\prime\prime}_\cdot1\]$](/articles/aa/full_html/2026/05/aa58212-25/aa58212-25-eq48.png) with width
with width ![Mathematical equation: $\[0^{\prime\prime}_\cdot003\]$](/articles/aa/full_html/2026/05/aa58212-25/aa58212-25-eq49.png) , and two asymmetric arcs centred at (
, and two asymmetric arcs centred at (![Mathematical equation: $\[{\sim} 1^{\prime\prime}_\cdot2\]$](/articles/aa/full_html/2026/05/aa58212-25/aa58212-25-eq50.png) , 298°) and (
, 298°) and (![Mathematical equation: $\[{\sim} 1^{\prime\prime}_\cdot3\]$](/articles/aa/full_html/2026/05/aa58212-25/aa58212-25-eq51.png) , 227°), with radial width of
, 227°), with radial width of ![Mathematical equation: $\[{\sim} 0^{\prime\prime}_\cdot14\]$](/articles/aa/full_html/2026/05/aa58212-25/aa58212-25-eq52.png) and
and ![Mathematical equation: $\[{\sim} 0^{\prime\prime}_\cdot18\]$](/articles/aa/full_html/2026/05/aa58212-25/aa58212-25-eq53.png) and an azimuthal FWHM of 82° and 107°, in contrast with the single arc centred at 240° with an FWHM of 155° modelled by van der Marel et al. (2021). Additionally, we find an inclination and PA that differ by 2° and 23° from those reported in van der Marel et al. (2021).
and an azimuthal FWHM of 82° and 107°, in contrast with the single arc centred at 240° with an FWHM of 155° modelled by van der Marel et al. (2021). Additionally, we find an inclination and PA that differ by 2° and 23° from those reported in van der Marel et al. (2021).
5 Discussion
5.1 Dust trapping
In van der Marel et al. (2021), the authors analysed a sample of transition discs showing a variety of crescents, aiming to model them as anticyclonic vortices. They constructed emission azimuthal profiles based on the analytical model4 of Birnstiel et al. (2013), which computes analytically the equilibrium between azimuthal drift and mixing of dust particles, and comparing their FWHM with that extracted from the data azimuthal profiles, as a function of the observed Stokes number defined as
![Mathematical equation: $\[\mathrm{St}_{\mathrm{obs}}=\frac{\lambda_{\mathrm{obs}} \rho_{\mathrm{s}}}{4 \sum_{\mathrm{gas}}\left(R_{\mathrm{dust}}\right)},\]$](/articles/aa/full_html/2026/05/aa58212-25/aa58212-25-eq54.png) (4)
(4)
with λobs the observed wavelength, ρs the intrinsic dust density, and Σg(Rdust) the gas density at the ring location (Rdust). Then, they model the gas surface density distribution as
![Mathematical equation: $\[\Sigma(R, y)=\Sigma_{\mathrm{g}}(R) \frac{1+(A_{\mathrm{gas}}-1) \exp (-\frac{y^2}{2 R^2 \sigma_y^2})}{1+(A_{\mathrm{gas}}-1) \frac{\sigma_y}{2 \sqrt{2 \pi}} \operatorname{Erf}(\frac{\sqrt{2 \pi}}{\sigma_y})},\]$](/articles/aa/full_html/2026/05/aa58212-25/aa58212-25-eq55.png) (5)
(5)
with y = Rθ the azimuthal coordinate along the ring, Agas the gas overdensity contrast, σy its azimuthal width, Erf the error function, and the normalisation is chosen so that the azimuthal average of the surface density would be its radial profile. In addition to the surface density parameters Agas and σy, the analytical model of Birnstiel et al. (2013) depends also on the viscosity α, the maximum grain size amax, the fragmentation velocity vfrag, and the dust-to-gas volume ratio ϵ. Then, by visually comparing the observed Stokes number measured from their discs with the model prediction, van der Marel et al. (2021) found that the best set of parameters describing their sample, including IRS 48 and HD 142527, was: Agas = 1.2, σy = 10°, α = 10−3, amax = 1 mm, vfrag = 5 ms−1, and ϵ = 0.1. However, they also specify the presence of degeneracies in the parameter space, for example between viscosity, dust-to-gas ratio, and/or gas overdensity, or the use of either a grain size distribution with a fixed maximum grain size or the steady-state equilibrium model from Birnstiel et al. (2011).
We follow the same approach to compute the emission azimuthal profile and reproduce our new HD 34700A data, assuming a power law gas surface density radial profile Σg(R) = Σc(R/Rc)−1 and evaluating Eq. (5) at the radial location of the peak intensity maximum Rpeak. We assume the steady-state dust distribution from Birnstiel et al. (2011) for the dust population and we compute the optical depth τ = ∑i ∑iκabs,i, with Σi and κabs,i the surface density and ‘DSHARP’-mixture absorption opacity associated with grains of size i, taken from Birnstiel et al. (2018), and finally obtain the intensity profile of the emission Iν = Bν(Tdust)(1 − e−τ), assuming a vertically isothermal disc with radial profile Tdust = Tc(R/Rc)−0.5, with Tc = 20 K at Rc = 100 au.
In Figure 4, we show the observed azimuthal profile at the radial location of the peak intensity (137 au) and the intensity profile of the model, obtained by manually changing the input parameters until visually reproducing the observed profile. Although the parameter space is highly degenerate, as discussed in van der Marel et al. (2021), we can constrain some of the parameters under the assumption that the dust overdensity is caused by a vortex. In fact, vortices need low viscosity to be long lived (α ≲ 10−4−10−3; Zhu & Stone 2014; Bae et al. 2015; Rometsch et al. 2021) and concentrate dust such that the dust-to-gas ratio is locally increased. As a result, we find that the observed azimuthal profile is best reproduced for the following choice of parameters: Agas = 1.1, σy = 75°, α = 5 × 10⁻⁴, Σc = 50 gcm−2 at Rc = 1 au, vfrag = 5 ms−1, and ϵ = 0.1.
While this set of parameters results in a model matching the observed intensity azimuthal profile on a qualitative level, it should not be taken as a unique solution. Increasing (decreasing) the α viscosity produces a lower (higher) peak-to-valley ratio of the profile, while raising (reducing) either ϵ or Σg shifts the azimuthal profile upwards (downwards). The width of the azimuthal profile is proportional azimuthal width σy of the gas bump, whereas increasing (decreasing) the overdensity contrast Agas increments (decrements) the peak-to-valley ratio of the profile and produces a narrower (wider) profile. As a result, different combinations of the parameters might still reproduce the observed profile. However, with this analysis we do not aim to obtain a quantitative description of the observe profile, but to demonstrate that it is possible to reproduce it by invoking the dust trapping scenario.
Although this model can reproduce qualitatively the observed intensity azimuthal profile of the peak emission for the HD 34700A system, it does not recover the elongated trailing tail that we see in Figs. 1 and 4. The asymmetric nature of the azimuthal profile might be indicative of dust segregation, with different sized dust grains trapped at different locations. This effect was shown in the simulations of Hammer et al. (2019), where they studied an elongated planet-induced vortex, featuring large grains concentrated close to the vortex centre and small grains circulating across the entirety of the vortex, producing an off centred peak emission and a skewed azimuthal profile. Multi-wavelength observations are needed to confirm the dust segregation scenario and further assess the vortex origin of the asymmetric emission.
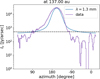 |
Fig. 4 Comparison between azimuthal profile of the observed dust emission at the radial location of the peak intensity (purple line) and model intensity azimuthal profile (blue line) for the HD 34700A system. The dashed black line corresponds to the azimuthal average of the observed intensity at 170 au. |
5.2 Origin of the asymmetry
A possible explanation for the high contrast continuum asymmetries observed in Figure 1 is gas anticyclonic vortices trapping dust in both the radial and azimuthal directions. Indeed, vortices have been suggested to be present in all the systems we consider in this work.
For IRS 48, van der Marel et al. (2013) reproduced the crescent by first simulating the gas distribution using FARGO3D, with a single sub-stellar companion carving the cavity for 1200 orbits, exciting RWI and producing a vortex. Then, starting from the resulting gas surface density, they computed the dust evolution and distribution with the model from Birnstiel et al. (2013), reproducing the observed contrast. Then, from polarimetric ALMA observations, Yang et al. (2024) inferred that the dust grains in the overdensity of IRS 48 are moderately settled, with a gas-to-dust scale height ratio of 2, and measured a turbulent α parameter in the range [10−4−5 × 10⁻³], consistent with the presence of a turbulent vortex. In HD 142527, Boehler et al. (2021) observed kinematic deviations from the gas Keplerian rotation in the 13CO and C18O line emission velocity maps, consistent with a ±40 au, 200° large vortex, although a similar pattern might arise as a consequence of beam smearing in the presence of gas pressure gradients at the inner and outer edges of the disc. Multiple line, high-resolution observations are needed to confirm either scenario. Finally, Stadler et al. (2026) recently analysed high-resolution (![Mathematical equation: $\[0^{\prime\prime}_\cdot1\]$](/articles/aa/full_html/2026/05/aa58212-25/aa58212-25-eq56.png) ) ALMA observations of 12CO, 13CO, and C18O lines in the system HD 34700 A. They find tentative evidence of an elongated Doppler flip co-located with the continuum asymmetry in 13CO and C18O, similarly to HD 142527 (Boehler et al. 2021), and model it as a kinematic signature of a vortex (Wölfer et al. 2025).
) ALMA observations of 12CO, 13CO, and C18O lines in the system HD 34700 A. They find tentative evidence of an elongated Doppler flip co-located with the continuum asymmetry in 13CO and C18O, similarly to HD 142527 (Boehler et al. 2021), and model it as a kinematic signature of a vortex (Wölfer et al. 2025).
These three systems host young (<10 Myr) stars, which typically have a higher multiplicity fraction compared to main sequence stars (Offner et al. 2023). Both HD 34700A and HD 142527 host a binary with a mass ratio q > 0.05, which naturally carve an eccentric cavity (Ragusa et al. 2017, 2020) with size of up to (6abin) (Penzlin et al. 2024, 2025; Sudarshan et al. 2022). However, with a binary separation of 0.69 au for HD 34700A (Sterzik et al. 2005) and 10.8 au for HD 142527 (Nowak et al. 2024), the observed cavity sizes are too large to be explained by binary interaction alone, as shown by the simulations of HD 142527 in Penzlin et al. (2024).
Interestingly, a possible cause for the formation of a vortex is the presence of a planet carving the cavity (Bae et al. 2016; Lyra et al. 2009; de Val-Borro et al. 2007; Hammer & Lin 2023). Indeed, a massive companion would help the binaries of HD 34700A and HD 142527, and the star in IRS 48 clear their large cavities, sustaining the RWI instability at its edge and triggering the formation of an anti-cyclonic vortex (Hammer et al. 2021). The presence of a planet might also explain the asymmetrical nature of the crescent we see in Figure 1 (Hammer et al. 2019). Notably, Hammer et al. (2017) have shown that slowly growing planets trigger weaker but more elongated vortices, which, in combination with typical vortex lifetimes of ≲1000 local orbits (Fung & Ono 2021; Rometsch et al. 2021), suggests that the object responsible for the observed vortex must not have migrated too far inwards from the current location of the vortex between its formation and today. Testing this scenario would require follow-up observations aiming to detect a companion within the disc cavity.
Infalling streamers hitting the disc are another mechanism that can produce vortices (Bae et al. 2015; Kuznetsova et al. 2022). While IRS 48 and HD 142527 show no evidence of interactions with the environment, Stadler et al. (2026) have suggested the presence of infalling streamers on the HD 34700A disc from spectral line analysis of 12CO. The strongest deviations from the disc rotation, probably associated to the location where the streamer hits the disc, are located in the vicinity of the dust crescent. It is unclear if the asymmetry in HD 34700A is due to the infall, the presence of an undetected massive companion carving the cavity or a combination of the two.
HD 142527 is unique in that the asymmetry is best fit by two Gaussian curves in azimuth with our model. This configuration could be explained by either two recently formed RWI vortices that are in the process of coalescing, or the superposition of a vortex and the bright emission near the apocentre of an eccentric cavity (e.g. Penzlin et al. 2024; Calcino et al. 2019). The former scenario is highly unlikely due to its narrow time window. On the other hand, a massive companion could excite both an eccentric cavity (Kley & Dirksen 2006; Tanaka et al. 2022) and a massive vortex on its edge, making it a favourable formation scenario in the absence of environmental factors such as infall.
5.3 Dust distribution around a massive vortex
In the previous paragraph we discussed several possible scenarios for the origin of the observed dust asymmetries, assuming they are vortices. Here, we would like to investigate the distribution of dust grains across the vortex, including the degree of asymmetry with respect to its centre, regardless of the origin of the vortex.
We model an HD 34700A analogue using the hydrodynamics code PLUTO (Mignone et al. 2007) with a vertically-integrated, cylindrical ({R, ϕ}) grid extending between 0.4–2.5 R0 in radius with R0 = 150 au, and spanning the full 2π in azimuth, with NR × Nϕ = 512 × 1024 cells and logarithmic spacing in radius. We utilise second-order spatial and temporal accuracy, the HLLC solver (Toro et al. 1994), a locally isothermal equation of state, the dust fluid module described in Ziampras et al. (2025), and the FARGO method to both improve numerical accuracy and drastically accelerate computations (Masset 2000; Mignone et al. 2012). The central object is modelled as a single star with M⋆ = 4 M⊙.
The numerical model is initialised with a disc of gas and dust that follow radial power-law profiles with Σg = 1 g cm−2 (R/R0)−1 and Σd = 0.01 Σg, including a cavity interior to R0 similar to Sudarshan et al. (2022), and an aspect ratio profile h = 0.15 (R/R0)1/4. Finally, we include viscous stress following Shakura & Sunyaev (1973) with α = 10−4 and a dust diffusion prescription following Weber et al. (2019).
We include six dust fluids with fixed grain sizes ad = {10−4, 0.001, 0.003, 0.01, 0.03, 0.1} cm and bulk densities of ![Mathematical equation: $\[\tilde{\rho}= 2.08 \mathrm{~g} \mathrm{~cm}^{-3}\]$](/articles/aa/full_html/2026/05/aa58212-25/aa58212-25-eq57.png) , coupled to the gas in the Epstein drag regime. The initial dust fluid densities are weighed such that
, coupled to the gas in the Epstein drag regime. The initial dust fluid densities are weighed such that ![Mathematical equation: $\[\Sigma_{\mathrm{d}, i} \propto a_{\mathrm{d}, i}^{q+4}\]$](/articles/aa/full_html/2026/05/aa58212-25/aa58212-25-eq58.png) with q = −3.5, corresponding to an MRN distribution (Mathis et al. 1977).
with q = −3.5, corresponding to an MRN distribution (Mathis et al. 1977).
Our profile for h is quite in line with expectations beyond 100 au for typical disc parameters, even if possibly rather unrealistic for a passively irradiated disc with the particular stellar parameters for HD 34700 A. Nevertheless, given that we are aiming for a generic, proof-of-concept model, and that the cavity edge in HD 34700A is anyway likely directly exposed to stellar irradiation (thus increasing the temperature and therefore h to values around 0.1–0.12), this choice is justified for our purposes.
With these initial conditions, the cavity edge at ~R0 is unstable to the RWI (Lovelace et al. 1999) and should collapse to a vortex. To form a massive vortex, we added a radially Gaussian distribution of gas and dust with a FWHM of 2H0 = 0.3 R0 centred at R0, and seeded their velocity fields with noise of up to 1% of the local sound speed before integrating for 100 orbits at R0.
Immediately as the simulation begins, the cavity edge collapses into several vortices that coalesce into a single massive vortex over the first ~20 orbits. By the end of the simulation, a large, quasi-stable vortex has been established, with dust species of different sizes trapped at varying degree around it.
To produce the synthetic image at ν = 230 GHz (λ = 1.3 mm) we compute the intensity at that frequency using
![Mathematical equation: $\[I_\nu(\boldsymbol{R})=B(\nu, T)\left(1-e^{-\tau_\nu}\right), \quad \tau_\nu(\boldsymbol{R})=\sum_i \kappa_{\nu, i} \Sigma_{\mathrm{d}, i}(\boldsymbol{R}),\]$](/articles/aa/full_html/2026/05/aa58212-25/aa58212-25-eq59.png) (6)
(6)
which we then convolve with a beam of angular size ![Mathematical equation: $\[0^{\prime\prime}_\cdot114\times0^{\prime\prime}_\cdot094\]$](/articles/aa/full_html/2026/05/aa58212-25/aa58212-25-eq60.png) and layer with Gaussian noise convolved with the same beam and with an RMS of 7 μJy/beam. The result is shown in Fig. 5, using the same spatial extent and colourbar stretch as Fig. 1. We find that the synthetic image largely reproduces the features found around the cavity in the HD 34700A system, with the emission around the vortex showing a (mild) asymmetrical tail (bottom right quadrant in the figure).
and layer with Gaussian noise convolved with the same beam and with an RMS of 7 μJy/beam. The result is shown in Fig. 5, using the same spatial extent and colourbar stretch as Fig. 1. We find that the synthetic image largely reproduces the features found around the cavity in the HD 34700A system, with the emission around the vortex showing a (mild) asymmetrical tail (bottom right quadrant in the figure).
We note that the emission in our model can be rescaled to arbitrary radial scales and distances, provided that the dynamics of the gas and dust (related to h and the Stokes number St ![Mathematical equation: $\[\propto \tilde{\rho} a_{\mathrm{d}} / \Sigma_{\mathrm{g}}\]$](/articles/aa/full_html/2026/05/aa58212-25/aa58212-25-eq61.png) ) are not changed. As a result, this model does not necessarily constrain the exact gas or dust properties around HD 34700A beyond highlighting the requirement for large grains trapped in the vortex, which was already inferred in Sect. 5.1. Nevertheless, our model shows that non-axisymmetric emission with a large azimuthal extent can be easily (re)produced with a massive vortex, a structure that can naturally form in protoplanetary discs.
) are not changed. As a result, this model does not necessarily constrain the exact gas or dust properties around HD 34700A beyond highlighting the requirement for large grains trapped in the vortex, which was already inferred in Sect. 5.1. Nevertheless, our model shows that non-axisymmetric emission with a large azimuthal extent can be easily (re)produced with a massive vortex, a structure that can naturally form in protoplanetary discs.
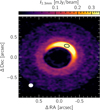 |
Fig. 5 Synthetic observation of an HD 34700A analogue using a multi-fluid hydrodynamical simulation of a vortex. The emission is optically thin with the exception of the centre of the vortex (black circle after convolving). A slight tail is visible on the simulated vortex, similar to the observations of HD 34700A and IRS 48. |
5.4 Disc eccentricity
Our galario models assume circular rings and arcs with no eccentricity. Yang et al. (2023) measured a high eccentricity of 0.27 in the dust ring of IRS 48, clearly motivated by the evident offset of the star with respect of the ring centre. In Figure 1 we mark the centre of the disc corrected with the galario offset, which is displaced with respect to the inner disc emission that surrounds the central stars. This can be indicative of a non-zero eccentricity of the dust ring also in HD 34700A and HD 142527, which is more evident in the polar maps in Figure 2. Indeed, the de-projected rings would appear as a straight horizontal line in these plots if they were circular, but instead the ring and the asymmetry peak at different radii, with the tail of the asymmetry connecting them spanning different radii. Additionally, azimuthal profiles taken at the same radial distance inwards and outwards from the peak intensity (see right column of Figure 2, comparing orange with red profiles and blue with purple profiles) are different from each other. This can be due to the possible eccentricity of the rings, or indicative of an asymmetric morphology of the rings and overdensities along the radial direction, or a combination of the two effects. Using numerical 3D hydrodynamical simulations, Price et al. (2018) showed that an eccentric circumbinary ring can be the result of an eccentric binary orbit. Later on, numerical studies from Ragusa et al. (2020); Penzlin et al. (2024) demonstrated that circumbinary disc can develop non zero eccentricity also in the case of a binary with a circular orbit, or as a consequence of the thermodynamical properties of the disc (Penzlin et al. 2025).
In order to measure the eccentricity of the discs, we expand Eqs. (1)–(3) to include eccentric rings and arcs. We parameterise the radial centre using:
![Mathematical equation: $\[r=a \frac{1-e^2}{1-e ~\cos (\phi-\omega)},\]$](/articles/aa/full_html/2026/05/aa58212-25/aa58212-25-eq62.png) (7)
(7)
where a is the semi-major axis of the ellipse, e its eccentricity, and ω the argument of periastron. This parametrisation assumes that the coordinate system is centred on the focus of the ellipse. We fix the eccentricity to be the same for all the ring and arc components in each disc model, and start the fitting procedure using these new parameters. We use the best-fit parameters we obtained for the circular models as initial guesses for the galario runs with the eccentric models, using the same setup we introduced in Sect. 3.
The HD 34700A model converges to a solution with a = ![Mathematical equation: $\[529_{-3}^{+3}\]$](/articles/aa/full_html/2026/05/aa58212-25/aa58212-25-eq63.png) mas, e =
mas, e = ![Mathematical equation: $\[0.109_{-0.004}^{+0.005}\]$](/articles/aa/full_html/2026/05/aa58212-25/aa58212-25-eq64.png) , ω =
, ω = ![Mathematical equation: $\[105_{-7}^{+7}\]$](/articles/aa/full_html/2026/05/aa58212-25/aa58212-25-eq65.png) deg, ΔRA =
deg, ΔRA = ![Mathematical equation: $\[99.6_{-0.3}^{+0.6}\]$](/articles/aa/full_html/2026/05/aa58212-25/aa58212-25-eq66.png) μas, ΔDec =
μas, ΔDec = ![Mathematical equation: $\[19_{-5}^{+6}\]$](/articles/aa/full_html/2026/05/aa58212-25/aa58212-25-eq67.png) μas and the remaining parameters compatible within 3σ with those of the circular model. In particular, we find an inclination i =
μas and the remaining parameters compatible within 3σ with those of the circular model. In particular, we find an inclination i = ![Mathematical equation: $\[35.3_{-0.5}^{+0.6}\]$](/articles/aa/full_html/2026/05/aa58212-25/aa58212-25-eq68.png) deg and position angle PA =
deg and position angle PA = ![Mathematical equation: $\[90.0_{-0.6}^{+0.5}\]$](/articles/aa/full_html/2026/05/aa58212-25/aa58212-25-eq69.png) , in remarkable agreement with the geometrical parameters of the circular model. We note that in this case we use wide priors for the geometrical parameters since the beginning of the fitting procedure. In the cases of IRS 48 and HD 142527, the eccentric galario models do not reach convergence. This is possibly caused by the presence of the asymmetry, which is radially wider compared to the ring and obscures the cavity edge morphology, making it compatible with a wide range of parameters. This degeneracy prevents the MCMC procedure from converging on a well-constrained parameter set. The IRS 48 and HD 142527 datasets are more affected than HD 34700A as their asymmetries are azimuthally wider.
, in remarkable agreement with the geometrical parameters of the circular model. We note that in this case we use wide priors for the geometrical parameters since the beginning of the fitting procedure. In the cases of IRS 48 and HD 142527, the eccentric galario models do not reach convergence. This is possibly caused by the presence of the asymmetry, which is radially wider compared to the ring and obscures the cavity edge morphology, making it compatible with a wide range of parameters. This degeneracy prevents the MCMC procedure from converging on a well-constrained parameter set. The IRS 48 and HD 142527 datasets are more affected than HD 34700A as their asymmetries are azimuthally wider.
In Appendix C we show the model and residuals images of the eccentric model, and compare them with the circular case. The offset of the central component in the eccentric model is possibly caused by the presence of emission between the inner disc component and the asymmetry. It is interesting to note that the residuals in both the eccentric and circular models do not show any substantial difference. This suggests that there is a degeneracy between the circular and eccentric model, and it is currently unclear if the disc around HD 34700A is circular or eccentric.
6 Conclusions
In this paper we present new high-resolution (![Mathematical equation: $\[0^{\prime\prime}_\cdot11\]$](/articles/aa/full_html/2026/05/aa58212-25/aa58212-25-eq70.png) ) ALMA band 6 (1.3 mm) continuum observations of the system HD 34700 A. We compare its emission to two other systems featuring a similar morphology, IRS 48 and HD 142527, and perform visibility modelling of the new ALMA data, while also improving existing models for the other two systems, using the code galario. Our results are summarised as follows:
) ALMA band 6 (1.3 mm) continuum observations of the system HD 34700 A. We compare its emission to two other systems featuring a similar morphology, IRS 48 and HD 142527, and perform visibility modelling of the new ALMA data, while also improving existing models for the other two systems, using the code galario. Our results are summarised as follows:
In the continuum data of HD 34700A we observe a cavity and resolve an asymmetric ring with a de-projected radius of
![Mathematical equation: $\[0^{\prime\prime}_\cdot53\]$](/articles/aa/full_html/2026/05/aa58212-25/aa58212-25-eq71.png) (186 au) and a peak intensity contrast of 62, making HD 34700A the transition disc with the second most prominent continuum asymmetry detected by ALMA to date. The dust overdensity is asymmetric, with a tail trailing with respect to the rotation of the gas, and peaks at
(186 au) and a peak intensity contrast of 62, making HD 34700A the transition disc with the second most prominent continuum asymmetry detected by ALMA to date. The dust overdensity is asymmetric, with a tail trailing with respect to the rotation of the gas, and peaks at ![Mathematical equation: $\[0^{\prime\prime}_\cdot39\]$](/articles/aa/full_html/2026/05/aa58212-25/aa58212-25-eq72.png) (137 au), with a PA of 227° and an azimuthal extent of more than 180°.
(137 au), with a PA of 227° and an azimuthal extent of more than 180°.Our galario model for HD 34700A is in remarkable agreement with the data, with residuals of up to 7.4σ localised only in the region of the asymmetric tail. Based on our model, we measure an azimuthal FWHM of 43.2° for the asymmetry. The central emission is offset compared to the disc centre corrected with the galario offset, suggesting that the ring is eccentric. We improve the existing galario model for HD 142527 (van der Marel et al. 2021), retrieving the double peaked structure of the ring. In this case we observe residuals of up to 20.1σ (6.2% of peak intensity) all across the ring, an improvement by a factor ~6 compared to the previous model, implying that the morphology is more complex than the Gaussian prescription in our model. For IRS 48, instead, we obtain a model similar to that of van der Marel et al. (2021), failing to recover the ring emission. We measure residuals of up to 96σ and −150σ, corresponding to 8.6 and 13.5% of the peak intensity, respectively.
We compare the continuum emission of the three transition discs with the most asymmetric rings. All systems have a large dust cavity that cannot be explained by binary-disc interaction alone, an inner emission offset with respect to the disc centre, indicative of an eccentric ring, and a high contrast overdensity with an asymmetric tail trailing with respect to the disc’s rotation. The high azimuthal contrast of the asymmetries rules out the orbit clustering of eccentric cavities scenario (Ataiee et al. 2013). A vortex has been proposed to explain the origin of the dust asymmetry, through kinematic analysis for HD 34700A (Stadler et al. 2026) and HD 142527 (Boehler et al. 2021), and dust polarisation measurements for IRS 48 (Yang et al. 2024).
We measure the eccentricity of the ring around HD 34700 A, adapting our visibility models to fit eccentric rings and arcs, finding an eccentricity of 0.109. However, the model show a degeneracy with the circular solution, thus our estimates do not confirm that the system is eccentric.
Under the vortex assumption, we reproduce the observed azimuthal profile of the emission using the analytical dust model of Birnstiel et al. (2013), by manually changing the input parameters. However, we stress that this solution might not be unique, as the parameter space is highly degenerate, and serves the purpose of providing a qualitative idea for the physical parameters associated with the possible dust trapping vortex.
A hydrodynamic model of a massive vortex yields qualitatively similar features to those found in HD 34700A and, to an extent, IRS 48, in that the emission around the vortex shows a mild asymmetry between the leading and trailing sides. In combination with the above point, this suggests that the vortex scenario is indeed a plausible explanation for these features.
We have shown that the observed asymmetry can be consistent with the dust trapping scenario. However, it is currently unclear which physical mechanism is causing the observed azimuthal asymmetric rings in the discs of HD 34700 A, IRS 48, and HD 142527. While the presence of a vortex might explain the observed signatures, and it has been tentatively proposed for all the systems we consider, an alternative explanation might lie in the presence of a gas overdensity induce by eccentric cavities due to binary companions (Shi et al. 2012; Ragusa et al. 2017; Miranda et al. 2017). In order to differentiate between the two scenarios, higher spatial resolution (![Mathematical equation: $\[{\lesssim}0^{\prime\prime}_\cdot1\]$](/articles/aa/full_html/2026/05/aa58212-25/aa58212-25-eq73.png) ) observations are needed to detect the rotational kinematic pattern of a vortex. At the same time, multi-wavelength observations of the dust continuum emission would constrain the distribution of dust grains with different sizes, which are expected to show a shift in the spatial location of the peak emission in the presence of a vortex (Cazzoletti et al. 2018).
) observations are needed to detect the rotational kinematic pattern of a vortex. At the same time, multi-wavelength observations of the dust continuum emission would constrain the distribution of dust grains with different sizes, which are expected to show a shift in the spatial location of the peak emission in the presence of a vortex (Cazzoletti et al. 2018).
Acknowledgements
D.F. acknowledges Clement Baruteau, Aleksandra Kuznetsova, Anibal Sierra, and Daniel Price for the helpful scientific discussions. DF also acknowledges Milou Temmink and Haifeng Yang for sharing the calibrated data of HD 142527 and IRS 48. M.B. acknowledges Marco Tazzari for the development of Galario. This project has received funding from the European Research Council (ERC) under the European Union’s Horizon 2020 research and innovation programme (PROTOPLANETS, grant agreement No. 101002188). S.F. is funded by the European Union (ERC, UNVEIL, 101076613) and acknowledges financial contribution from PRIN-MUR 2022YP5ACE. A.Z. acknowledges funding from the European Union under the European Union’s Horizon Europe Research and Innovation Programme 101124282 (EARLY-BIRD). E.R. acknowledges support from the European Union (ERC Starting Grant DiscEvol, project number 101039651). Views and opinions expressed are, however, those of the author(s) only and do not necessarily reflect those of the European Union or the European Research Council. Neither the European Union nor the granting authority can be held responsible for them. This paper makes use of the following ALMA data: ADS/JAO.ALMA#2013.1.00305.S, ADS/JAO.ALMA#2019.1.01059.S, ADS/JAO.ALMA#2022.1.00760.S. ALMA is a partnership of ESO (representing its member states), NSF (USA) and NINS (Japan), together with NRC (Canada), NSTC and ASIAA (Taiwan), and KASI (Republic of Korea), in cooperation with the Republic of Chile. The Joint ALMA Observatory is operated by ESO, AUI/NRAO and NAOJ.
References
- Andrews, S. M. 2020, ARA&A, 58, 483 [Google Scholar]
- Andrews, S. M., Huang, J., Pérez, L. M., et al. 2018, ApJ, 869, L41 [NASA ADS] [CrossRef] [Google Scholar]
- Ataiee, S., Pinilla, P., Zsom, A., et al. 2013, A&A, 553, L3 [NASA ADS] [CrossRef] [EDP Sciences] [Google Scholar]
- Bae, J., Hartmann, L., & Zhu, Z. 2015, ApJ, 805, 15 [NASA ADS] [CrossRef] [Google Scholar]
- Bae, J., Zhu, Z., & Hartmann, L. 2016, ApJ, 819, 134 [NASA ADS] [CrossRef] [Google Scholar]
- Bae, J., Isella, A., Zhu, Z., et al. 2023, ASP Conf. Ser., 534, 423 [NASA ADS] [Google Scholar]
- Barge, P., & Sommeria, J. 1995, A&A, 295, L1 [NASA ADS] [Google Scholar]
- Baruteau, C., & Zhu, Z. 2016, MNRAS, 458, 3927 [NASA ADS] [CrossRef] [Google Scholar]
- Benac, P., Matrà, L., Wilner, D. J., et al. 2020, ApJ, 905, 120 [NASA ADS] [CrossRef] [Google Scholar]
- Biller, B., Lacour, S., Juhász, A., et al. 2012, ApJ, 753, L38 [Google Scholar]
- Birnstiel, T., Ormel, C. W., & Dullemond, C. P. 2011, A&A, 525, A11 [NASA ADS] [CrossRef] [EDP Sciences] [Google Scholar]
- Birnstiel, T., Dullemond, C. P., & Pinilla, P. 2013, A&A, 550, L8 [NASA ADS] [CrossRef] [EDP Sciences] [Google Scholar]
- Birnstiel, T., Dullemond, C. P., Zhu, Z., et al. 2018, ApJ, 869, L45 [CrossRef] [Google Scholar]
- Boehler, Y., Weaver, E., Isella, A., et al. 2017, ApJ, 840, 60 [Google Scholar]
- Boehler, Y., Ménard, F., Robert, C. M. T., et al. 2021, A&A, 650, A59 [NASA ADS] [CrossRef] [EDP Sciences] [Google Scholar]
- Bohn, A. J., Benisty, M., Perraut, K., et al. 2022, A&A, 658, A183 [NASA ADS] [CrossRef] [EDP Sciences] [Google Scholar]
- Brown, J. M., Herczeg, G. J., Pontoppidan, K. M., & van Dishoeck, E. F. 2012, ApJ, 744, 116 [Google Scholar]
- Bruderer, S., van der Marel, N., van Dishoeck, E. F., & van Kempen, T. A. 2014, A&A, 562, A26 [NASA ADS] [CrossRef] [EDP Sciences] [Google Scholar]
- Calcino, J., Price, D. J., Pinte, C., et al. 2019, MNRAS, 490, 2579 [Google Scholar]
- CASA Team, Bean, B., Bhatnagar, S., et al. 2022, PASP, 134, 114501 [NASA ADS] [CrossRef] [Google Scholar]
- Casassus, S., van der Plas, G. M., Perez, S., et al. 2013, Nature, 493, 191 [Google Scholar]
- Cazzoletti, P., van Dishoeck, E. F., Pinilla, P., et al. 2018, A&A, 619, A161 [NASA ADS] [CrossRef] [EDP Sciences] [Google Scholar]
- Claudi, R., Maire, A. L., Mesa, D., et al. 2019, A&A, 622, A96 [NASA ADS] [CrossRef] [EDP Sciences] [Google Scholar]
- Columba, G., Rigliaco, E., Gratton, R., et al. 2024, A&A, 681, A19 [NASA ADS] [CrossRef] [EDP Sciences] [Google Scholar]
- de Val-Borro, M., Artymowicz, P., D’Angelo, G., & Peplinski, A. 2007, A&A, 471, 1043 [NASA ADS] [CrossRef] [EDP Sciences] [Google Scholar]
- Dong, R., van der Marel, N., Hashimoto, J., et al. 2017, ApJ, 836, 201 [NASA ADS] [CrossRef] [Google Scholar]
- Espaillat, C., Muzerolle, J., Najita, J., et al. 2014, in Protostars and Planets VI, eds. H. Beuther, R. S. Klessen, C. P. Dullemond, & T. Henning (Tucson: University of Arizona Press), 497 [Google Scholar]
- Fairlamb, J. R., Oudmaijer, R. D., Mendigutía, I., Ilee, J. D., & van den Ancker, M. E. 2015, MNRAS, 453, 976 [Google Scholar]
- Flaherty, K., Hughes, A. M., Simon, J. B., et al. 2020, ApJ, 895, 109 [NASA ADS] [CrossRef] [Google Scholar]
- Foreman-Mackey, D., Hogg, D. W., Lang, D., & Goodman, J. 2013, PASP, 125, 306 [Google Scholar]
- Francis, L., & van der Marel, N. 2020, ApJ, 892, 111 [Google Scholar]
- Fukagawa, M., Hashimoto, J., Tamura, M., & Seeds/Hiciao/Ircs/Ao188. 2013, ASP Conf. Ser., 476, 157 [Google Scholar]
- Fung, J., & Ono, T. 2021, ApJ, 922, 13 [NASA ADS] [CrossRef] [Google Scholar]
- Gaia Collaboration (Vallenari, A., et al.) 2023, A&A, 674, A1 [NASA ADS] [CrossRef] [EDP Sciences] [Google Scholar]
- Hammer, M., & Lin, M.-K. 2023, MNRAS, 525, 123 [NASA ADS] [CrossRef] [Google Scholar]
- Hammer, M., Kratter, K. M., & Lin, M.-K. 2017, MNRAS, 466, 3533 [NASA ADS] [CrossRef] [Google Scholar]
- Hammer, M., Pinilla, P., Kratter, K. M., & Lin, M.-K. 2019, MNRAS, 482, 3609 [NASA ADS] [CrossRef] [Google Scholar]
- Hammer, M., Lin, M.-K., Kratter, K. M., & Pinilla, P. 2021, MNRAS, 504, 3963 [NASA ADS] [CrossRef] [Google Scholar]
- Huang, P., Isella, A., Li, H., Li, S., & Ji, J. 2018, ApJ, 867, 3 [NASA ADS] [CrossRef] [Google Scholar]
- Izquierdo, A. F., Testi, L., Facchini, S., Rosotti, G. P., & van Dishoeck, E. F. 2021, A&A, 650, A179 [NASA ADS] [CrossRef] [EDP Sciences] [Google Scholar]
- Izquierdo, A. F., Stadler, J., Galloway-Sprietsma, M., et al. 2025, ApJ, 984, L8 [Google Scholar]
- Kley, W., & Dirksen, G. 2006, A&A, 447, 369 [NASA ADS] [CrossRef] [EDP Sciences] [Google Scholar]
- Kuznetsova, A., Bae, J., Hartmann, L., & Mac Low, M.-M. 2022, ApJ, 928, 92 [NASA ADS] [CrossRef] [Google Scholar]
- Lacour, S., Biller, B., Cheetham, A., et al. 2016, A&A, 590, A90 [NASA ADS] [CrossRef] [EDP Sciences] [Google Scholar]
- Li, H., Colgate, S. A., & Lovelace, R. V. E. 2000, AAS/High Energy Astrophys. Div., 5, 02.15 [Google Scholar]
- Long, F., Pinilla, P., Herczeg, G. J., et al. 2018, ApJ, 869, 17 [Google Scholar]
- Lovelace, R. V. E., Li, H., Colgate, S. A., & Nelson, A. F. 1999, ApJ, 513, 805 [NASA ADS] [CrossRef] [Google Scholar]
- Lovell, J. B., Hales, A. S., Kennedy, G. M., et al. 2026, A&A, 705, A200 [NASA ADS] [CrossRef] [EDP Sciences] [Google Scholar]
- Lyra, W., & Lin, M.-K. 2013, ApJ, 775, 17 [Google Scholar]
- Lyra, W., Johansen, A., Klahr, H., & Piskunov, N. 2009, A&A, 493, 1125 [NASA ADS] [CrossRef] [EDP Sciences] [Google Scholar]
- Marino, S., Perez, S., & Casassus, S. 2015, ApJ, 798, L44 [Google Scholar]
- Marino, S., Gupta, V., Weber, P., et al. 2026, A&A, 705, A202 [NASA ADS] [CrossRef] [EDP Sciences] [Google Scholar]
- Masset, F. 2000, A&AS, 141, 165 [NASA ADS] [Google Scholar]
- Mathis, J. S., Rumpl, W., & Nordsieck, K. H. 1977, ApJ, 217, 425 [Google Scholar]
- Mignone, A., Bodo, G., Massaglia, S., et al. 2007, in JENAM-2007, “Our Non-Stable Universe”, 96 [Google Scholar]
- Mignone, A., Zanni, C., Tzeferacos, P., et al. 2012, ApJS, 198, 7 [Google Scholar]
- Miranda, R., Muñoz, D. J., & Lai, D. 2017, MNRAS, 466, 1170 [NASA ADS] [CrossRef] [Google Scholar]
- Monnier, J. D., Harries, T. J., Bae, J., et al. 2019, ApJ, 872, 122 [Google Scholar]
- Nowak, M., Rowther, S., Lacour, S., et al. 2024, A&A, 683, A6 [NASA ADS] [CrossRef] [EDP Sciences] [Google Scholar]
- Offner, S. S. R., Moe, M., Kratter, K. M., et al. 2023, ASP Conf. Ser., 534, 275 [NASA ADS] [Google Scholar]
- Penzlin, A. B. T., Booth, R. A., Nelson, R. P., Schäfer, C. M., & Kley, W. 2024, MNRAS, 532, 3166 [Google Scholar]
- Penzlin, A. B. T., Ziampras, A., Kurtovic, N. T., Barraza-Alfaro, M., & Pinilla, P. 2025, MNRAS, 544, 3312 [Google Scholar]
- Pinilla, P., Benisty, M., & Birnstiel, T. 2012, A&A, 545, A81 [NASA ADS] [CrossRef] [EDP Sciences] [Google Scholar]
- Price, D. J., Cuello, N., Pinte, C., et al. 2018, MNRAS, 477, 1270 [Google Scholar]
- Ragusa, E., Dipierro, G., Lodato, G., Laibe, G., & Price, D. J. 2017, MNRAS, 464, 1449 [Google Scholar]
- Ragusa, E., Alexander, R., Calcino, J., Hirsh, K., & Price, D. J. 2020, MNRAS, 499, 3362 [NASA ADS] [CrossRef] [Google Scholar]
- Ragusa, E., Lynch, E., Laibe, G., Longarini, C., & Ceppi, S. 2024, A&A, 686, A264 [NASA ADS] [CrossRef] [EDP Sciences] [Google Scholar]
- Regály, Z., Juhász, A., Sándor, Z., & Dullemond, C. P. 2012, MNRAS, 419, 1701 [Google Scholar]
- Robert, C. M. T., Méheut, H., & Ménard, F. 2020, A&A, 641, A128 [NASA ADS] [CrossRef] [EDP Sciences] [Google Scholar]
- Rometsch, T., Ziampras, A., Kley, W., & Béthune, W. 2021, A&A, 656, A130 [NASA ADS] [CrossRef] [EDP Sciences] [Google Scholar]
- Rosotti, G. P. 2023, New A Rev., 96, 101674 [NASA ADS] [CrossRef] [Google Scholar]
- Scheuck, M. B., van Boekel, R., Henning, T., et al. 2026, 708, A380 [Google Scholar]
- Schworer, G., Lacour, S., Huélamo, N., et al. 2017, ApJ, 842, 77 [NASA ADS] [CrossRef] [Google Scholar]
- Shakura, N. I., & Sunyaev, R. A. 1973, A&A, 24, 337 [NASA ADS] [Google Scholar]
- Shi, J.-M., Krolik, J. H., Lubow, S. H., & Hawley, J. F. 2012, ApJ, 749, 118 [Google Scholar]
- Stadler, J., Benisty, M., Zagaria, F., et al. 2026, A&A, 707, A160 (Paper I) [NASA ADS] [CrossRef] [EDP Sciences] [Google Scholar]
- Sterzik, M. F., Melo, C. H. F., Tokovinin, A. A., & van der Bliek, N. 2005, A&A, 434, 671 [NASA ADS] [CrossRef] [EDP Sciences] [Google Scholar]
- Strom, K. M., Strom, S. E., Edwards, S., Cabrit, S., & Skrutskie, M. F. 1989, AJ, 97, 1451 [Google Scholar]
- Sudarshan, P., Penzlin, A. B. T., Ziampras, A., Kley, W., & Nelson, R. P. 2022, A&A, 664, A157 [NASA ADS] [CrossRef] [EDP Sciences] [Google Scholar]
- Surville, C., & Mayer, L. 2019, ApJ, 883, 176 [NASA ADS] [CrossRef] [Google Scholar]
- Surville, C., Mayer, L., & Lin, D. N. C. 2016, ApJ, 831, 82 [NASA ADS] [CrossRef] [Google Scholar]
- Tanaka, Y. A., Kanagawa, K. D., Tanaka, H., & Tanigawa, T. 2022, ApJ, 925, 95 [NASA ADS] [CrossRef] [Google Scholar]
- Tazzari, M., Beaujean, F., & Testi, L. 2018, MNRAS, 476, 4527 [Google Scholar]
- Teague, R. 2019, J. Open Source Softw., 4, 1632 [NASA ADS] [CrossRef] [Google Scholar]
- Teague, R., Benisty, M., Facchini, S., et al. 2025, ApJ, 984, L6 [Google Scholar]
- Temmink, M., Booth, A. S., van der Marel, N., & van Dishoeck, E. F. 2023, A&A, 675, A131 [NASA ADS] [CrossRef] [EDP Sciences] [Google Scholar]
- Toro, E. F., Spruce, M., & Speares, W. 1994, Shock Waves, 4, 25 [Google Scholar]
- Torres, G. 2004, AJ, 127, 1187 [NASA ADS] [CrossRef] [Google Scholar]
- Uyama, T., Currie, T., Christiaens, V., et al. 2020, AAS Meeting Abstracts, 236, 304.05 [Google Scholar]
- van der Marel, N., van Dishoeck, E. F., Bruderer, S., et al. 2013, Science, 340, 1199 [Google Scholar]
- van der Marel, N., Pinilla, P., Tobin, J., et al. 2015, ApJ, 810, L7 [Google Scholar]
- van der Marel, N., van Dishoeck, E. F., Bruderer, S., et al. 2016a, A&A, 585, A58 [NASA ADS] [CrossRef] [EDP Sciences] [Google Scholar]
- van der Marel, N., van Dishoeck, E. F., Bruderer, S., et al. 2016b, IAU Symp., 314, 139 [Google Scholar]
- van der Marel, N., Birnstiel, T., Garufi, A., et al. 2021, AJ, 161, 33 [Google Scholar]
- Virtanen, P., Gommers, R., Burovski, E., et al. 2020, scipy/scipy: SciPy 1.6.0 [Google Scholar]
- Weber, P., Pérez, S., Benítez-Llambay, P., et al. 2019, ApJ, 884, 178 [NASA ADS] [CrossRef] [Google Scholar]
- Wölfer, L., Facchini, S., van der Marel, N., et al. 2023, A&A, 670, A154 [CrossRef] [EDP Sciences] [Google Scholar]
- Wölfer, L., Barraza-Alfaro, M., Teague, R., et al. 2025, ApJ, 984, L22 [Google Scholar]
- Yang, H., Fernández-López, M., Li, Z.-Y., et al. 2023, ApJ, 948, L2 [NASA ADS] [CrossRef] [Google Scholar]
- Yang, H., Fernández-López, M., Li, Z.-Y., et al. 2024, ApJ, 963, 134 [NASA ADS] [CrossRef] [Google Scholar]
- Zhu, Z., & Stone, J. M. 2014, ApJ, 795, 53 [Google Scholar]
- Ziampras, A., Sudarshan, P., Dullemond, C. P., et al. 2025, MNRAS, 536, 3322 [NASA ADS] [CrossRef] [Google Scholar]
For very high contrast discs, where the emission of the ring is not detected across all azimuths, a different approach is typically used, evaluating the contrast as the ratio between the peak intensity and either the emission at the same radius shifted by 180° or the 3σ upper limit.
See Sect. 10.2.6 in the ALMA Technical Handbook.
For HD 142527 we compute the azimuthal average along the same radius of the peak intensity. For HD 34700A and IRS 48, instead, we perform the azimuthal average along the radius at 170 au and 65 au, as the ring looks more eccentric.
Appendix A Observations
Summary of the data used in this work.
In Table A.1 we report the observing log associated to the ALMA datasets presented for the first time in this paper.
Appendix B Visibility Modelling
galario best fit parameters
In Table B.1 we summarise the best fit parameters resulting from our visibility modelling of HD 34700 A, IRS 48, HD 142527 observations. We have adopted the following priors:
HD 34700 A = {log10 f0 = [1.0, 10.0], r0 = [0.0, 0.15] arcsec, log10 f1 = [1.0, 10.0], r1 = [0.0, 1.0] arcsec, σr,1 = [0.0, 0.2] arcsec, log10 ![Mathematical equation: $\[f_{1}^{\mathrm{a}}\]$](/articles/aa/full_html/2026/05/aa58212-25/aa58212-25-eq137.png) = [1.0, 11.0],
= [1.0, 11.0], ![Mathematical equation: $\[r_{1}^{\mathrm{a}}\]$](/articles/aa/full_html/2026/05/aa58212-25/aa58212-25-eq138.png) = [0.0, 1.0] arcsec,
= [0.0, 1.0] arcsec, ![Mathematical equation: $\[\sigma_{r, 1}^{\mathrm{a}}\]$](/articles/aa/full_html/2026/05/aa58212-25/aa58212-25-eq139.png) = [0.0, 0.2] arcsec,
= [0.0, 0.2] arcsec, ![Mathematical equation: $\[\theta_{1}^{\mathrm{a}}\]$](/articles/aa/full_html/2026/05/aa58212-25/aa58212-25-eq140.png) = [0.0, 360.0] arcsec,
= [0.0, 360.0] arcsec, ![Mathematical equation: $\[\sigma_{\theta, l 1}^{\mathrm{a}}\]$](/articles/aa/full_html/2026/05/aa58212-25/aa58212-25-eq141.png) = [0.0, 180.0] arcsec,
= [0.0, 180.0] arcsec, ![Mathematical equation: $\[\sigma_{\theta, r 1}^{\mathrm{a}}\]$](/articles/aa/full_html/2026/05/aa58212-25/aa58212-25-eq142.png) = [0.0, 180.0] arcsec, i = [35.0, 37.0] deg, PA = [92.5, 93.5] deg, ΔRa = [−0.1, 0.1] arcsec, ΔDec = [−0.1, 0.1] arcsec},
= [0.0, 180.0] arcsec, i = [35.0, 37.0] deg, PA = [92.5, 93.5] deg, ΔRa = [−0.1, 0.1] arcsec, ΔDec = [−0.1, 0.1] arcsec},
IRS 48 = {log10 f1 = [1.0, 11.0], r1 = [0.4, 1.0] arcsec, σr,1 = [0.0, 0.2] arcsec, log10 ![Mathematical equation: $\[f_{1}^{\mathrm{a}}\]$](/articles/aa/full_html/2026/05/aa58212-25/aa58212-25-eq143.png) = [1.0, 12.0],
= [1.0, 12.0], ![Mathematical equation: $\[r_{1}^{\mathrm{a}}\]$](/articles/aa/full_html/2026/05/aa58212-25/aa58212-25-eq144.png) = [0.4, 0.6] arcsec,
= [0.4, 0.6] arcsec, ![Mathematical equation: $\[\sigma_{r, 1}^{\mathrm{a}}\]$](/articles/aa/full_html/2026/05/aa58212-25/aa58212-25-eq145.png) = [0.0, 0.2] arcsec,
= [0.0, 0.2] arcsec, ![Mathematical equation: $\[\theta_{1}^{\mathrm{a}}\]$](/articles/aa/full_html/2026/05/aa58212-25/aa58212-25-eq146.png) = [0.0, 360.0] arcsec,
= [0.0, 360.0] arcsec, ![Mathematical equation: $\[\sigma_{\theta, l 1}^{\mathrm{a}}\]$](/articles/aa/full_html/2026/05/aa58212-25/aa58212-25-eq147.png) = [0.0, 180.0] arcsec,
= [0.0, 180.0] arcsec, ![Mathematical equation: $\[\sigma_{\theta, r 1}^{\mathrm{a}}\]$](/articles/aa/full_html/2026/05/aa58212-25/aa58212-25-eq148.png) = [0.0, 180.0] arcsec, i = [49.0, 51.0] deg, PA = [99.0, 101.0] deg, ΔRa = [0.0, 0.5] arcsec, ΔDec = [0.0, 0.5] arcsec},
= [0.0, 180.0] arcsec, i = [49.0, 51.0] deg, PA = [99.0, 101.0] deg, ΔRa = [0.0, 0.5] arcsec, ΔDec = [0.0, 0.5] arcsec},
HD 142527 = {log10 f0 = [1.0, 12.0], x0 = [−0.2, 0.2], y0 = [−0.2, 0.2], r0 = [0.0, 0.2] arcsec, log10 f1 = [1.0, 12.0], r1 = [0.0, 2.0] arcsec, σr,1 = [0.0, 0.8] arcsec, log10 ![Mathematical equation: $\[f_{1}^{\mathrm{a}}\]$](/articles/aa/full_html/2026/05/aa58212-25/aa58212-25-eq149.png) = [1.0, 12.0],
= [1.0, 12.0], ![Mathematical equation: $\[r_{1}^{\mathrm{a}}\]$](/articles/aa/full_html/2026/05/aa58212-25/aa58212-25-eq150.png) = [0.0, 2.0] arcsec,
= [0.0, 2.0] arcsec, ![Mathematical equation: $\[\sigma_{r, 1}^{\mathrm{a}}\]$](/articles/aa/full_html/2026/05/aa58212-25/aa58212-25-eq151.png) = [0.0, 1.0] arcsec,
= [0.0, 1.0] arcsec, ![Mathematical equation: $\[\theta_{1}^{\mathrm{a}}\]$](/articles/aa/full_html/2026/05/aa58212-25/aa58212-25-eq152.png) = [0.0, 360.0] arcsec,
= [0.0, 360.0] arcsec, ![Mathematical equation: $\[\sigma_{\theta, l 1}^{\mathrm{a}}\]$](/articles/aa/full_html/2026/05/aa58212-25/aa58212-25-eq153.png) = [0.0, 180.0] arcsec,
= [0.0, 180.0] arcsec, ![Mathematical equation: $\[\sigma_{\theta, r 1}^{\mathrm{a}}\]$](/articles/aa/full_html/2026/05/aa58212-25/aa58212-25-eq154.png) = [0.0, 180.0] arcsec, log10
= [0.0, 180.0] arcsec, log10 ![Mathematical equation: $\[f_{2}^{\mathrm{a}}\]$](/articles/aa/full_html/2026/05/aa58212-25/aa58212-25-eq155.png) = [1.0, 12.0],
= [1.0, 12.0], ![Mathematical equation: $\[r_{2}^{\mathrm{a}}\]$](/articles/aa/full_html/2026/05/aa58212-25/aa58212-25-eq156.png) = [0.0, 2.0] arcsec,
= [0.0, 2.0] arcsec, ![Mathematical equation: $\[\sigma_{r, 2}^{\mathrm{a}}\]$](/articles/aa/full_html/2026/05/aa58212-25/aa58212-25-eq157.png) = [0.0, 1.0] arcsec,
= [0.0, 1.0] arcsec, ![Mathematical equation: $\[\theta_{2}^{\mathrm{a}}\]$](/articles/aa/full_html/2026/05/aa58212-25/aa58212-25-eq158.png) = [0.0, 360.0] arcsec,
= [0.0, 360.0] arcsec, ![Mathematical equation: $\[\sigma_{\theta, l 2}^{\mathrm{a}}\]$](/articles/aa/full_html/2026/05/aa58212-25/aa58212-25-eq159.png) = [0.0, 180.0] arcsec,
= [0.0, 180.0] arcsec, ![Mathematical equation: $\[\sigma_{\theta, r 2}^{\mathrm{a}}\]$](/articles/aa/full_html/2026/05/aa58212-25/aa58212-25-eq160.png) = [0.0, 180.0] arcsec, i = [20.0, 40.0] deg, PA = [150.0, 250.0] deg, ΔRa = [−0.3, 0.3] arcsec, ΔDec = [−0.3, 0.3] arcsec}.
= [0.0, 180.0] arcsec, i = [20.0, 40.0] deg, PA = [150.0, 250.0] deg, ΔRa = [−0.3, 0.3] arcsec, ΔDec = [−0.3, 0.3] arcsec}.
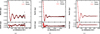 |
Fig. B.1 Real (top panel) and imaginary (bottom panel) parts of the re-centred and de-projected visibilities azimuthally averaged in bins with width of 20 kλ as a function of the de-projected baseline length for HD 34700A (left), IRS 48 (middle) and HD 142527 (right). The black points represent the visibility data points, while the red solid line corresponds to the galario best fit model. |
We choose narrow priors for the PA and inclination of HD 34700A in order to be consistent with the analysis of Stadler et al. (2026), using the values resulting from their 13CO discminer fit as initial guesses to help achieve convergence. We follow the same approach for IRS 48, using the inclination and PA reported in Yang et al. (2023). At a later stage, we check that allowing for wider priors does not significantly change the geometrical parameters.
In Figure B.1 we show the azimuthally averaged visibility profiles for HD 34700 A, IRS 48 and HD 142527 (black dots) and the best fit galario model (red solid line).
Appendix C Eccentric model
 |
Fig. C.1 CLEANed images of the galario model (left panel) and residuals (right panel) for the circular (a) and eccentric (b) models of HD 34700 A, same as middle and right columns of Fig. 3. |
In Fig. C.1 we compare the galario models and residuals of the HD 34700A system, assuming a circular model (same as middle and right columns of Fig. 3), with those obtained assuming an eccentric model, as explained in Sec. 5.4.
All Tables
All Figures
|
Fig. 1 Continuum images of HD 34700A (left), IRS 48 (middle), and HD 142527 (right). The white and black contours are taken at 3σ, 5σ, and 2nσ, with integer numbers n ≥ 3. The white plus sign marks the centre of the ring in the galario model, the ellipse in the bottom left corner represents the synthesised beam and the arrow in the bottom right corner shows the direction of the gas rotation. We apply an asinh stretch from {0.007, 0.007, 0.000} mJybeam−1 to a factor {0.2, 0.4, 0.7} of the peak intensity, using a stretch parameter of {0.1, 0.01, 0.1} to the colour scale to visually enhance the fainter emission. |
| In the text | |
|
Fig. 2 Left column: de-projected continuum images of HD 34700A (top), IRS 48 (middle), and HD 142527 (bottom) in polar coordinates. Contours are the same as in Figure 1. In the bottom left corner we show the rotation direction of the gas, while in the bottom right corner we show the beam size in the radial direction. Right column: azimuthal profiles of the de-projected continuum images from the left column, taken at different radii around the peak location, corresponding to the dashed lines with the same colours in the left column. We use the savgol_filter function of the scipy (Virtanen et al. 2020) module to smooth the oscillations introduced by the interpolation on the polar grid. We also show the ALMA beam size associated to the azimuthal profile evaluated at the peak radius. The plots have been shifted azimuthally so that the image peak is in the centre and the −180° azimuth coincide with the 180° azimuth. |
| In the text | |
|
Fig. 3 Top to bottom: images of HD 34700 A, IRS 48, and HD 142527. Left to right: continuum images, same as in Figure 1; CLEANed galario model images; CLEANed residual images; In the left and middle columns, contours are the same as in Figure 1. In the right column, white solid (positive) and dashed (negative) contours start at 3σ and 5σ, and increase by 5σ, while black contours correspond to the 3σ emission from the CLEANed model. |
| In the text | |
|
Fig. 4 Comparison between azimuthal profile of the observed dust emission at the radial location of the peak intensity (purple line) and model intensity azimuthal profile (blue line) for the HD 34700A system. The dashed black line corresponds to the azimuthal average of the observed intensity at 170 au. |
| In the text | |
|
Fig. 5 Synthetic observation of an HD 34700A analogue using a multi-fluid hydrodynamical simulation of a vortex. The emission is optically thin with the exception of the centre of the vortex (black circle after convolving). A slight tail is visible on the simulated vortex, similar to the observations of HD 34700A and IRS 48. |
| In the text | |
|
Fig. B.1 Real (top panel) and imaginary (bottom panel) parts of the re-centred and de-projected visibilities azimuthally averaged in bins with width of 20 kλ as a function of the de-projected baseline length for HD 34700A (left), IRS 48 (middle) and HD 142527 (right). The black points represent the visibility data points, while the red solid line corresponds to the galario best fit model. |
| In the text | |
|
Fig. C.1 CLEANed images of the galario model (left panel) and residuals (right panel) for the circular (a) and eccentric (b) models of HD 34700 A, same as middle and right columns of Fig. 3. |
| In the text | |
Current usage metrics show cumulative count of Article Views (full-text article views including HTML views, PDF and ePub downloads, according to the available data) and Abstracts Views on Vision4Press platform.
Data correspond to usage on the plateform after 2015. The current usage metrics is available 48-96 hours after online publication and is updated daily on week days.
Initial download of the metrics may take a while.