Fig. 3
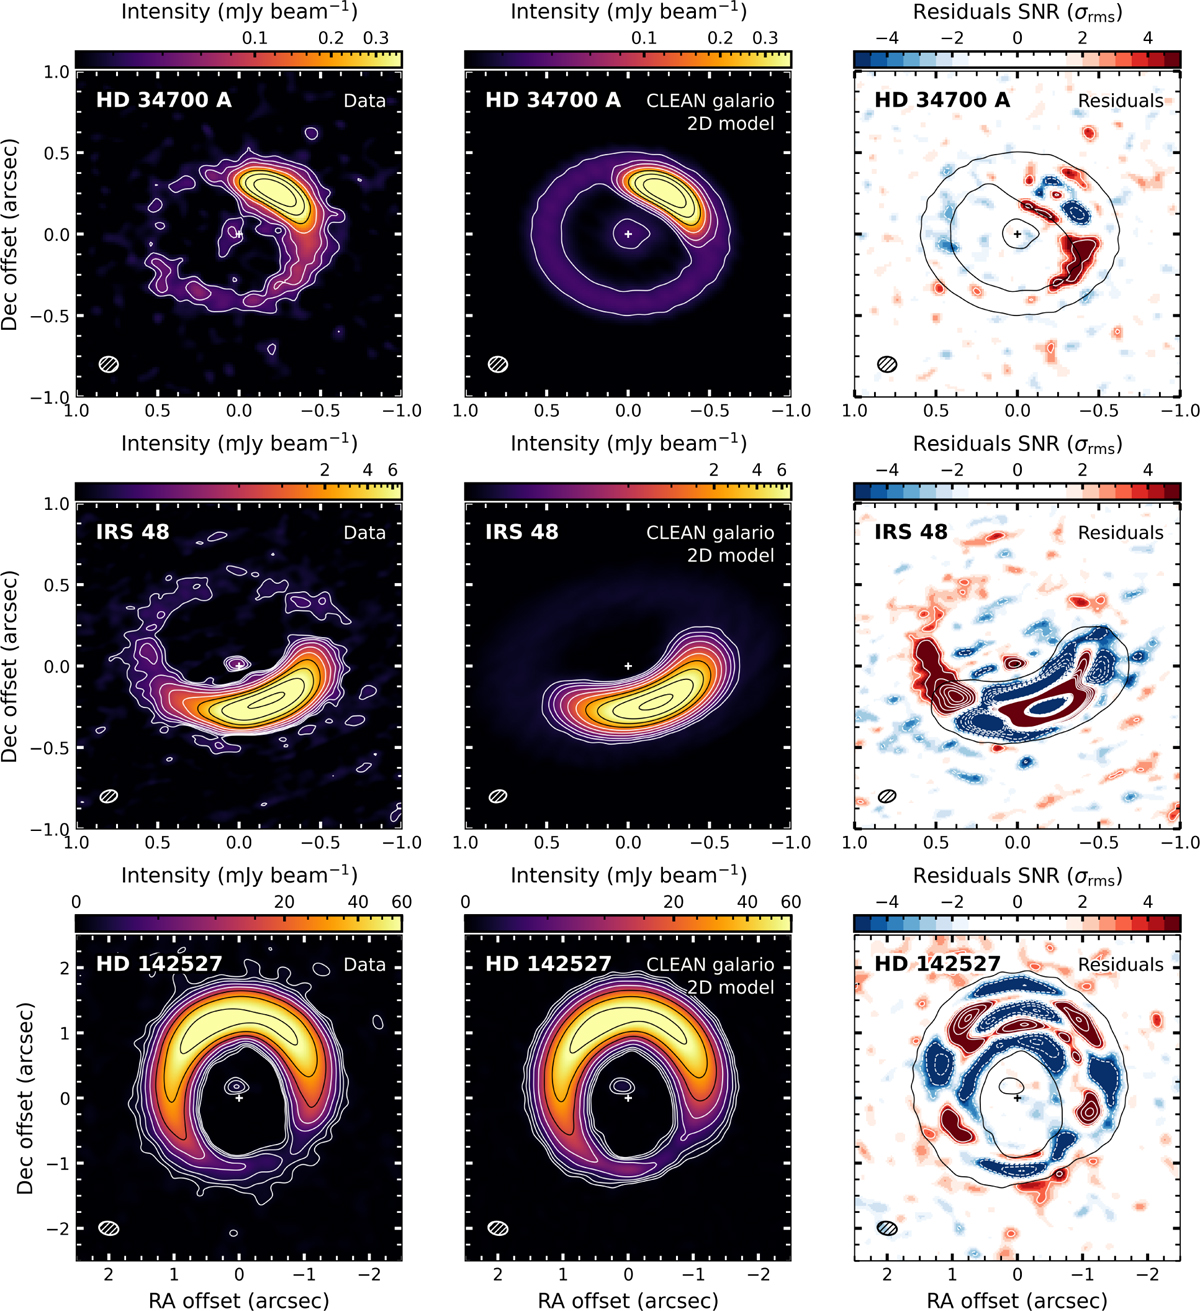
Download original image
Top to bottom: images of HD 34700 A, IRS 48, and HD 142527. Left to right: continuum images, same as in Figure 1; CLEANed galario model images; CLEANed residual images; In the left and middle columns, contours are the same as in Figure 1. In the right column, white solid (positive) and dashed (negative) contours start at 3σ and 5σ, and increase by 5σ, while black contours correspond to the 3σ emission from the CLEANed model.
Current usage metrics show cumulative count of Article Views (full-text article views including HTML views, PDF and ePub downloads, according to the available data) and Abstracts Views on Vision4Press platform.
Data correspond to usage on the plateform after 2015. The current usage metrics is available 48-96 hours after online publication and is updated daily on week days.
Initial download of the metrics may take a while.