Fig. B.1
Download original image
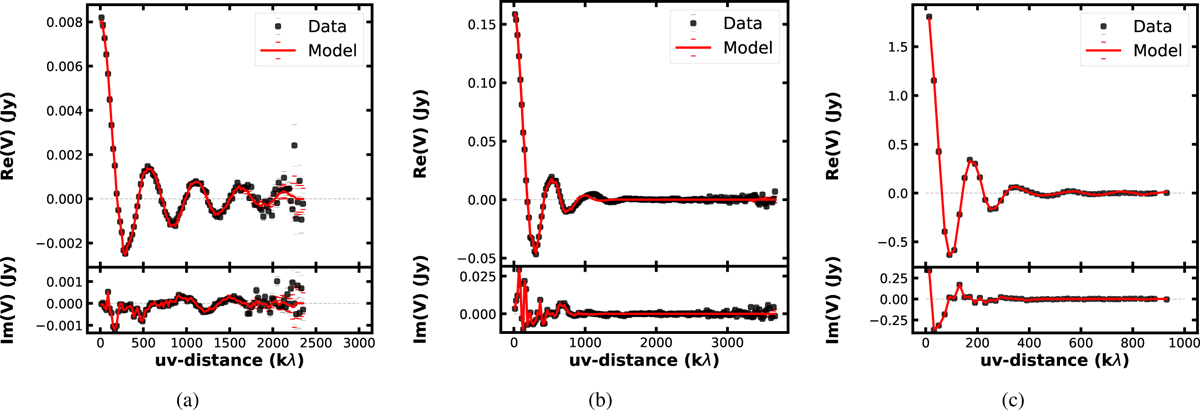
Real (top panel) and imaginary (bottom panel) parts of the re-centred and de-projected visibilities azimuthally averaged in bins with width of 20 kλ as a function of the de-projected baseline length for HD 34700A (left), IRS 48 (middle) and HD 142527 (right). The black points represent the visibility data points, while the red solid line corresponds to the galario best fit model.
Current usage metrics show cumulative count of Article Views (full-text article views including HTML views, PDF and ePub downloads, according to the available data) and Abstracts Views on Vision4Press platform.
Data correspond to usage on the plateform after 2015. The current usage metrics is available 48-96 hours after online publication and is updated daily on week days.
Initial download of the metrics may take a while.