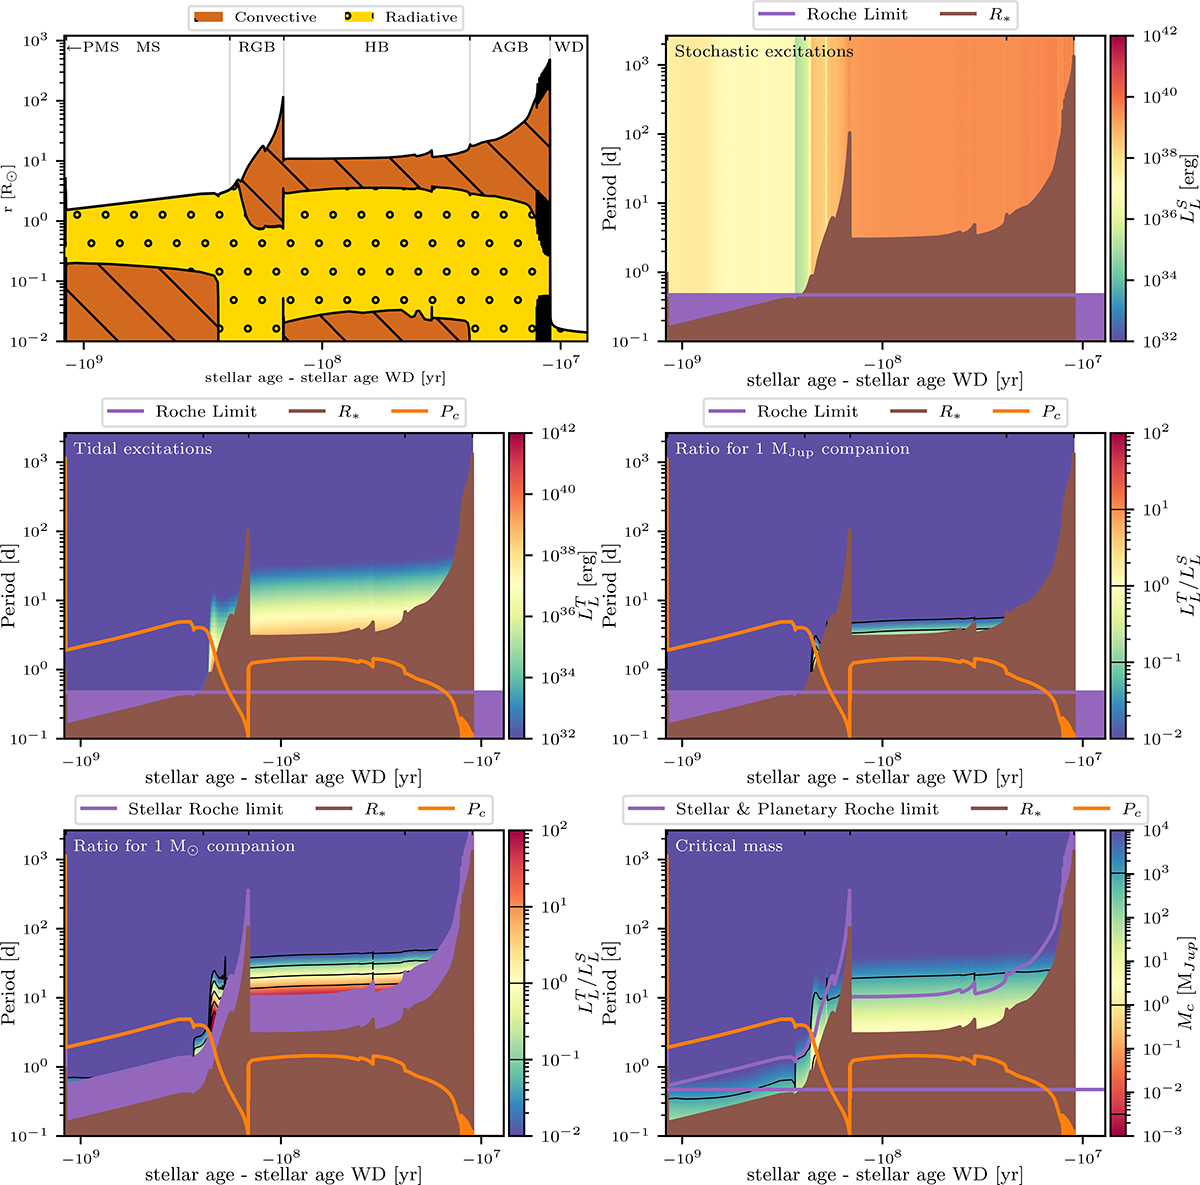
Fig. 11.
Download original image
Internal structure and angular momentum luminosities for a MZAMS = 2 M⊙ star. Top left: Kippenhahn diagram. The brown hatched regions represent convective layers, and the dotted yellow region represents radiative layers. Stellar evolutionary phases (pre-MS to WD) are indicated. Top right and centre left: Angular momentum luminosities carried by stochastically and tidally excited gravity waves as a function of orbital period and stellar age. Center right and bottom left: Ratio of the angular momentum luminosity carried by tidally excited waves to the angular momentum luminosity carried by stochastically excited waves as a function of orbital period and stellar age for a 1 MJup (centre right) and a 1 M⊙ (bottom left) companion. Bottom right: Critical mass as a function of orbital period and stellar age. The Roche limit is shown in purple, the critical period (4π/ωc; see Eq. 2) in orange, and the period at which a planet orbits at the stellar radius in brown. Changes in the stellar evolutionary phase are indicated with ticks on the upper axis.
Current usage metrics show cumulative count of Article Views (full-text article views including HTML views, PDF and ePub downloads, according to the available data) and Abstracts Views on Vision4Press platform.
Data correspond to usage on the plateform after 2015. The current usage metrics is available 48-96 hours after online publication and is updated daily on week days.
Initial download of the metrics may take a while.