Open Access
Fig. 2.
Download original image
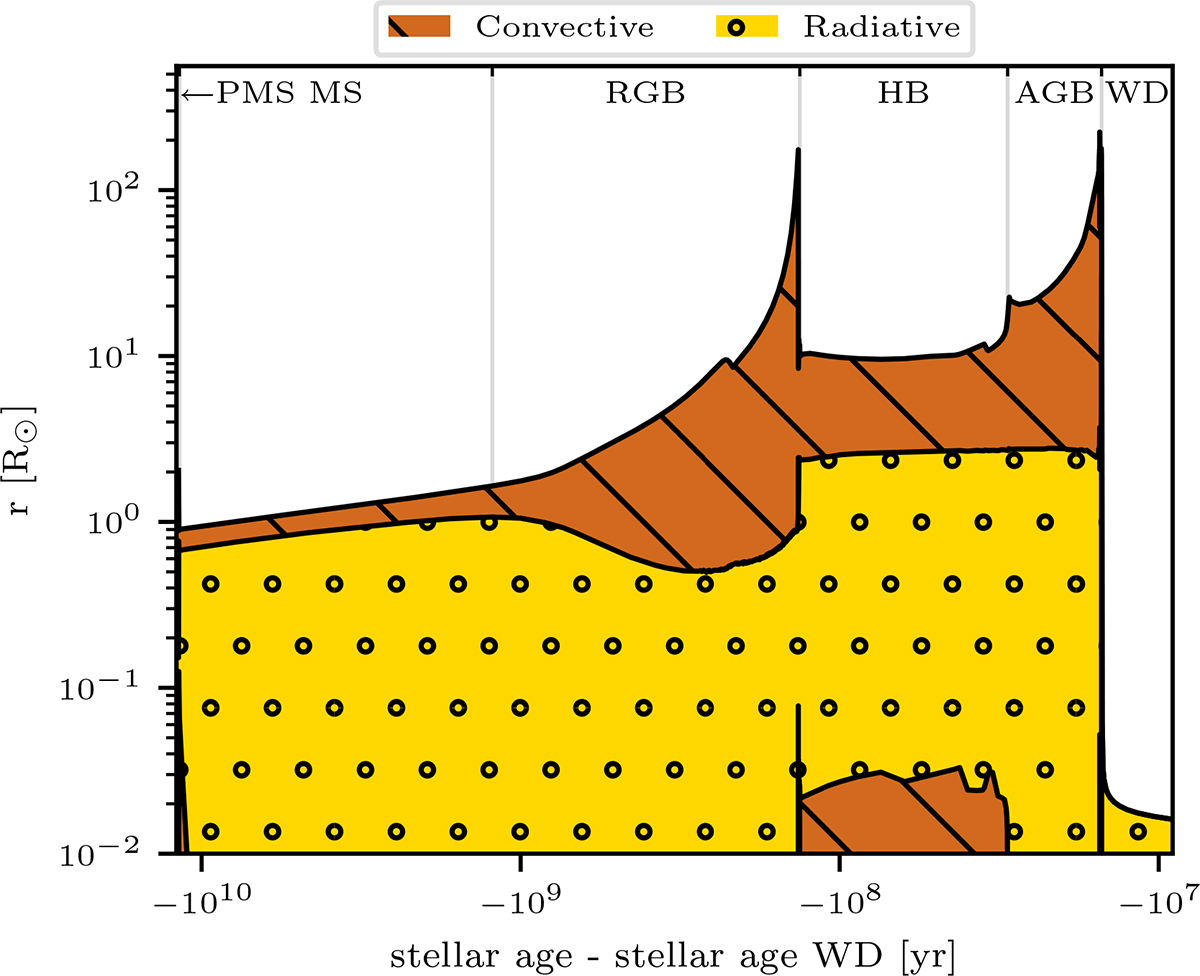
Kippenhahn diagram of the evolutionary stages of a MZAMS = 1 M⊙ star. All stellar evolutionary phases are indicated at the top. The dotted yellow region illustrates the radiative regions, and the brown hatched region illustrates the convective regions. Stellar evolutionary phases (pre-MS to WD) are indicated.
Current usage metrics show cumulative count of Article Views (full-text article views including HTML views, PDF and ePub downloads, according to the available data) and Abstracts Views on Vision4Press platform.
Data correspond to usage on the plateform after 2015. The current usage metrics is available 48-96 hours after online publication and is updated daily on week days.
Initial download of the metrics may take a while.