Fig. 3
Download original image
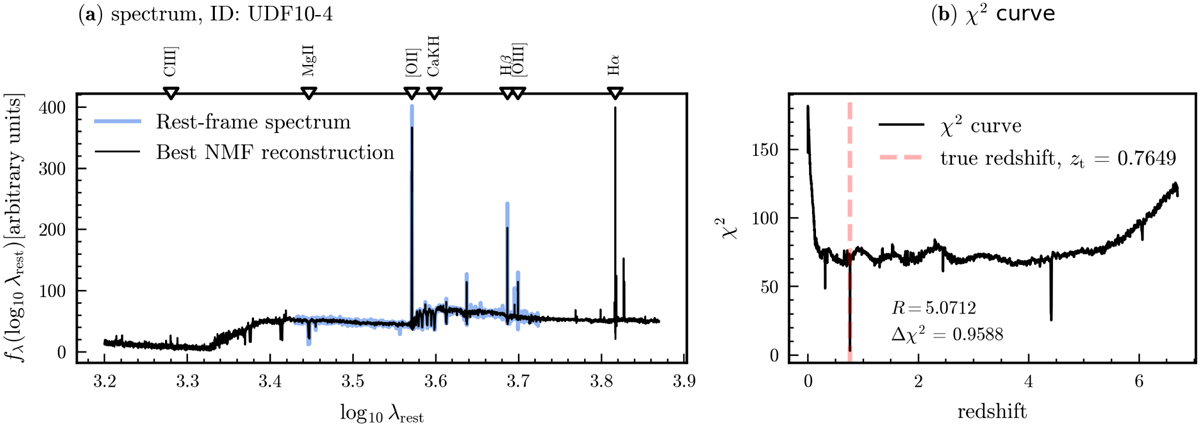
Illustration of redshift prediction with NMF basis vectors. (a) Rest-frame spectrum of the UDF10-4 source at redshift 0.7649 in blue. This galaxy exhibits stellar continuum, strong [O II], Hβ, and [O III] spectral emission lines (their locations are indicated on top of the figure); the best NMF reconstruction is plotted in black. (b) Corresponding χ2 curve, the minimum happens at the true redshift (vertical red dashed line), hence, successfully predicting the correct redshift. The second minimum in the χ2 curve at z ∼ 4.4 corresponds to a solution in which [O II] gets mistaken to be Lya. The values of the ∆χ2 and R metrics are also reported in (b); their values indicate a significant minimum and a very robust redshift prediction.
Current usage metrics show cumulative count of Article Views (full-text article views including HTML views, PDF and ePub downloads, according to the available data) and Abstracts Views on Vision4Press platform.
Data correspond to usage on the plateform after 2015. The current usage metrics is available 48-96 hours after online publication and is updated daily on week days.
Initial download of the metrics may take a while.