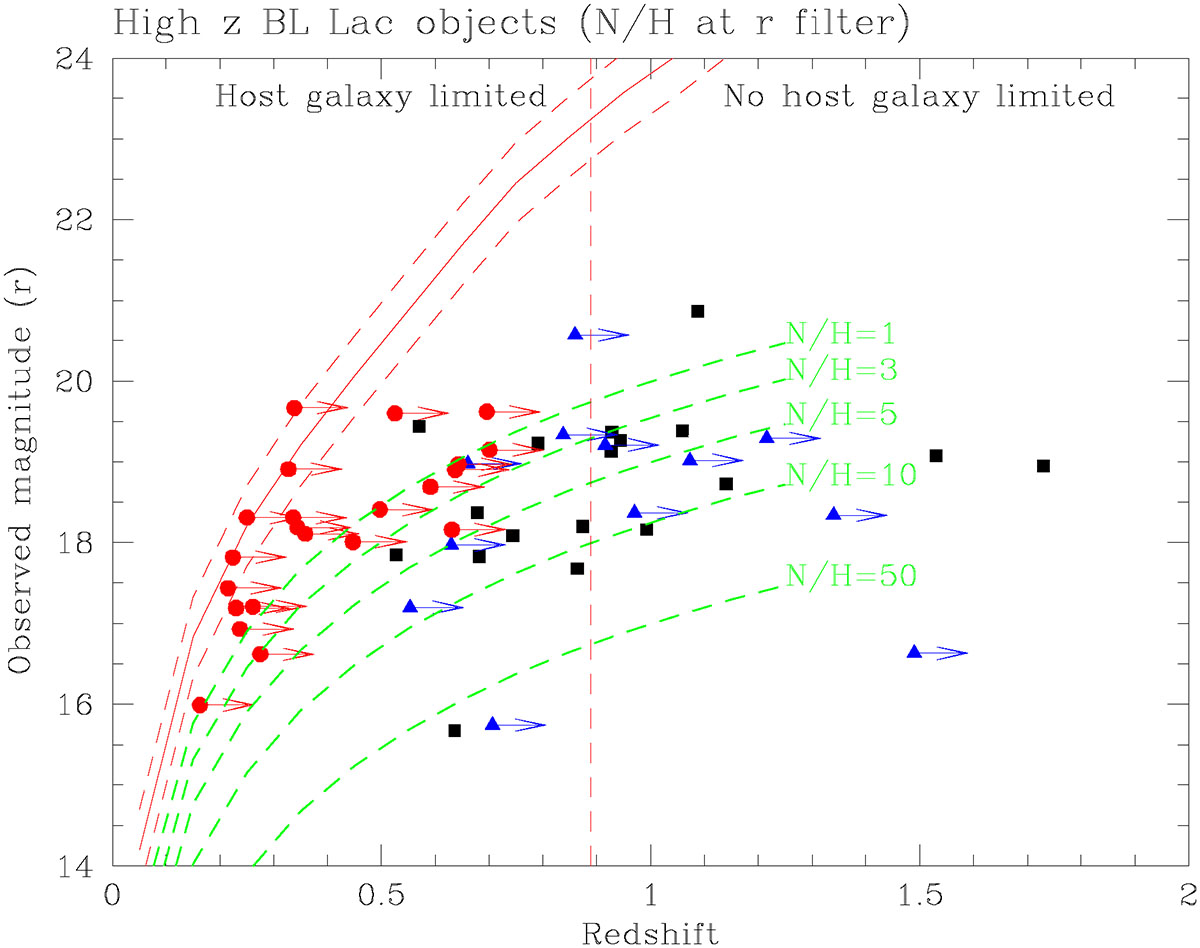
Fig. 4.
Download original image
The apparent r magnitude of the targets vs the redshift or their lower limits (arrows). Black squares are the objects with known z. The blue triangles with arrow come from spectroscopic lower limits due to intervening absorption systems. The red filled circles with arrows represent the lower limit of the redshift for objects with featureless spectra. These are based on the assumption they are hosted by a typical giant elliptical, that the non thermal nuclear component is described by a power, and that the CaII absorption features are smaller than the minimum EW of the observed spectra (see text and Paiano et al. (2017c) for more details). The red dashed vertical line yields the limit of the redshift where CaII lines can be detected in the observe spectral range. The solid red line represent the magnitude in the r band of a elliptical galaxy of M(R) = − 22.9 at various redshift. The two similar red dashed lines encompasses the solid line by 1 magnitude. The green dashed lines show the position in the plane z − r of BLL with a standard host galaxy and a non thermal nucleus (α = −1), at different N/H ratio (see text for more details).
Current usage metrics show cumulative count of Article Views (full-text article views including HTML views, PDF and ePub downloads, according to the available data) and Abstracts Views on Vision4Press platform.
Data correspond to usage on the plateform after 2015. The current usage metrics is available 48-96 hours after online publication and is updated daily on week days.
Initial download of the metrics may take a while.