| Issue |
A&A
Volume 709, May 2026
|
|
|---|---|---|
| Article Number | A107 | |
| Number of page(s) | 24 | |
| Section | Extragalactic astronomy | |
| DOI | https://doi.org/10.1051/0004-6361/202558277 | |
| Published online | 12 May 2026 | |
Optical spectroscopy of high-redshift BL Lac objects
1
INAF – Osservatorio Astronomico di Padova, Vicolo dell’Osservatorio 5, I-35122 Padova, (PD), Italy
2
INAF – Osservatorio Astronomico di Brera, via Bianchi 46, I-23807 Merate (Lecco), Italy
3
Università dell’Insubria, via Valleggio 11, 22100 Como, Italy
4
INAF – IASF Palermo, via Ugo La Malfa 153, I-90146 Palermo, Italy
5
Instituto de Astrofisica de Canarias, C/O Via Lactea, s/n, E38205 La Laguna (Tenerife), Spain
6
Universidad de La Laguna, Dpto. Astrofisica, s/n, E-38206 La Laguna (Tenerife), Spain
★ Corresponding author: This email address is being protected from spambots. You need JavaScript enabled to view it.
Received:
26
November
2025
Accepted:
24
March
2026
Abstract
BL Lac objects (BLLs) are defined by the presence of very weak (typically < 5 Å) or even absent spectral lines. This makes determining their distance particularly challenging, especially at high redshift, where the sources are fainter and the host galaxy contribution in the optical band becomes negligible. Yet measuring their distance is crucial for deriving and modelling their luminosity, notably in the gamma-ray band, where BLLs dominate the extragalactic sky. In this work, we re-examine the reported high-redshift (z > 0.6) BLLs, many of which are commonly cited in the literature despite appearing questionable. We present new spectra for 52 objects obtained with the 10.4 m GTC. For 16 of them we propose a new redshift or provide a spectroscopic lower limit, while for 14 sources we confirm previously published values. In 22 cases the spectra remain featureless, even with high S/N observations. These objects are likely to lie at 0.3 < z < 1.4; the lack of host-galaxy features sets a lower limit to their distance, while the absence of intervening absorption systems argues against substantially higher redshifts. We compare our findings with the previous robustly established cases of BLLs at z > 0.6 that meet our selection criteria.
Key words: galaxies: active / BL Lacertae objects: general / galaxies: distances and redshifts / galaxies: high-redshift
© The Authors 2026
 Open Access article, published by EDP Sciences, under the terms of the Creative Commons Attribution License (https://creativecommons.org/licenses/by/4.0), which permits unrestricted use, distribution, and reproduction in any medium, provided the original work is properly cited.
This article is published in open access under the Subscribe to Open model. This email address is being protected from spambots. You need JavaScript enabled to view it. to support open access publication.
1. Introduction
BL Lac objects (BLLs) are active galactic nuclei that are associated with relativistic jets pointing in the direction of the observer and are characterised by very weak or no emission lines in their optical spectra. The optical non-thermal continuum is usually well described by a power law and exhibits large and rapid flux variability (see e.g. Falomo et al. 2014). These sources dominate the gamma-ray sky: ∼50% of the Fermi extragalactic γ-ray sources are associated with BLL (Abdollahi et al. 2022; Ballet et al. 2023). They are supposed to constitute a large fraction or the majority of the high-energy neutrino sources detected by IceCube (see e.g. Giommi & Padovani 2021).
Accurate knowledge of the distance to BLLs is essential to being able to model their spectral energy distributions and intrinsic luminosities. Redshift is a key parameter for investigating particle acceleration mechanisms, jet formation, luminosity functions, cosmological evolution, and the contribution of these sources to the extragalactic gamma-ray background. At low redshift, the distance can often be determined through absorption features arising from the host galaxy. At high redshift, however, the situation becomes significantly more challenging. The intrinsic weakness of spectral features combined with the faintness of the sources and the decreasing contribution of the host galaxy to the observed optical spectrum makes redshift determination increasingly difficult.
To overcome these limitations, high-quality optical spectroscopy obtained with 10-m class telescopes is required to detect faint spectral features. Nevertheless, even with state-of-the-art instrumentation, emission and absorption lines from the nuclear region remain undetectable in a substantial fraction of high-redshift BLLs.
At high redshift, the probability that the BLL light transverses an intervening cloud of gas, such as the gas in the halo of galaxies, becomes relevant. In these cases, the detection of an intervening absorption through recognised absorption lines enables us to establish a spectroscopic lower limit to the redshift. Optical spectroscopy of BLL experienced a great impulse after the launch of the Fermi mission in 2008 (Atwood et al. 2009), which substantially increased the number of candidate targets (see in particular the extended campaigns by Shaw et al. (2012, 2013)). Complementary observations in other bands, such as X-rays (see e.g. Kerby et al. 2021; Kaur et al. 2023; Ulgiati et al. 2025, and references therein) and infrared with WISE (e.g. Massaro et al. 2012), allowed for the identification of a large number of BLLs. In preparation of the Cherenkov Telescope Array Observatory (CTAO), systematic spectroscopic observations of good TeV candidates were made by Rajput et al. (2025, and references therein), who selected candidates from Monte Carlo simulations of CTAO observations (see details in Goldoni et al. 2021). Very useful data on multi-frequency BLL observations up to 2015 are given in the BZCAT catalogue Massaro et al. (2015). Moreover, Sloan Digital Sky Survey (SDSS1) released a substantial number of BLL spectra. A number of spectroscopic studies have been carried out to determine the spectral properties and the redshift of these sources. (For recent contributions, see Sbarufatti et al. (2005b), Sandrinelli et al. (2013), Pita et al. (2014), Landoni et al. (2018), Peña-Herazo et al. (2020), Rajput et al. (2025).)
We have contributed to the determination of the redshift of BLLs through a number of papers considering unidentified gamma-ray Fermi objects (Paiano et al. 2017a, 2019; Ulgiati et al. 2024), concentrating on extragalactic sources possibly associated with high energy neutrinos (Paiano et al. 2018, 2021a, 2023), very luminous BLLs (Paiano et al. 2017c), and hard Fermi sources with counterparts in the TeV region explored by Cherenkov detectors (Paiano et al. 2020, 2021b). All spectra of BLLs studied in the above papers are reported in the ZBLLAC database2 (Landoni et al. 2020).
In this paper, we focus on high-z BLL candidates for which there is an indication in the literature and/or catalogues that the source is at a relatively high redshift but, in our opinion, appears dubious based on available data (see details in Sect. 2). To investigate these objects, we obtained optical spectra of 55 targets at the Gran Telescopio Canarias (GTC). The paper significantly extends a preliminary programme initiated by us (Landoni et al. 2018; Paiano et al. 2017b) in which 26 targets were observed.
The paper is organised as follows. In Sect. 2 the sample is described together with the adopted selection criteria. Then in Sect. 3 we describe the observations and the spectral analysis. The results are presented in Sect. 4, where the emission or absorption lines and the properties of continuum flux are discussed. For each source, references to previous spectral observations or redshift constraints and individual comments about our spectroscopic data are given in Appendix B. Finally, in Sect. 5 we summarise the results, compare them with previous reliable observations from the literature, and discuss our findings.
2. The sample
We searched for high-z (> 0.6) BLLs, selecting sources from the 4LAC Fermi gamma ray catalogue (Ajello et al. 2020, 2022) and the Roma-BZCAT catalogue (Massaro et al. 2015) with δ > −21° as the observability condition from the northern hemisphere. We selected 157 candidates. Then we searched for optical spectra in the literature of all these objects, finding at least one published spectrum for 145 targets. For 57 objects, the spectrum is of enough quality to determine a redshift or a lower limit ( see Table D.5, which reports the redshift and the reference). These data are discussed in Sect. 5. For the remaining 88 objects, the redshift is uncertain because of a low S/N or dubious line identification. We were able to secure optical spectra for 55 targets (see Table D.1). References for previous spectroscopic observations are given in the last column of Table D.1. The corresponding reference is given when a spectrum is available in electronic form or a published figure. For three sources, previous good quality spectra were already available, and the comparison with the new ones is discussed in Appendix C. In the following sections we report on the observations and the results for the sample of 52 targets.
3. Observations
The optical spectra were obtained with the 10.4-m GTC at the Roque de los Muchachos Observatory (La Palma) using the OSIRIS spectrograph (Cepa et al. 2003). We used the R1000B grism and a 1.2 arcsec slit, providing coverage over 3900–7750 Å with a spectral resolution of R ∼ 600.
Data reduction was carried out using standard IRAF procedures for long-slit spectroscopy (Tody 1986, 1993), following the approach described in Paiano et al. (2017c). Wavelength calibration was performed using Hg, Ar, Ne, and Xe arc-lamp spectra. The accuracy, based on the scatter of the polynomial fit (pixel versus wavelength), is ∼0.1 Å over the entire spectral range.
To ensure optimal removal of cosmic rays and other artefacts, each target was observed in at least three separate exposures, which also enabled us to identify and discard possible spurious features. The final spectrum was obtained by combining all individual exposures. Atmospheric-extinction correction was applied using the mean extinction coefficients for the La Palma site.
Spectro-photometric standard stars were observed each night to derive the relative flux calibration. The absolute calibration was then refined using the source magnitude measured in the acquisition images. For each acquisition frame, we determined the instrumental magnitude of several stars with the catalogued values in SDSS and/or Pan-STARRS, deriving the corresponding calibration constant. In all cases, the resulting accuracy is better than 0.1 mag. Finally, all spectra were de-reddened by applying the extinction law of Cardelli et al. (1989) and assuming the value of Galactic extinction E(B-V) derived from the NASA/IPAC Infrared Science Archive3 (Schlafly & Finkbeiner 2011).
4. Results
For the sample of 52 BLLs, we report the GTC optical spectrum in Fig. A.1. The magnitude and S/N of the spectrum can be found in Table D.2. Specific details for each source are reported in Appendix B, where we also note significant photometric variations relative to previous spectroscopic observations. In particular, when comparing our results with those by Shaw et al. (2012, 2013), we followed their indication and assumed a spectrophotometric accuracy of 30%.
4.1. Redshift and spectral features
For each spectrum, we searched for emission and absorption features with a (2σ) threshold of minimum equivalent width (EW) that ranges from 0.03 to 2 Å, depending on the S/N of the spectrum. In the cases where a feature was found, we carefully checked that it is present in all individual exposures (see details in Sect. 3). Close-ups of the main features are shown in Fig. A.2.
For 18 targets we found spectral lines that allowed us to determine the redshift (see Table D.2 ). In most cases (15) the redshift was derived from emission lines (see Table D.3), while for three targets (5BZBJ0726+3734, 4FGLJ0921.7+2336, and 5BZBJ1132+0034) the absorption features of CaII from the host galaxy were used. In ten of the cases, we confirm the previous redshift, while in eight cases a new one is proposed (see targets C in Table D.2)
For another 12 sources, we only detected intervening absorption lines that set a spectroscopic lower limit to the redshift (see Table D.4 ). In four of these cases, we confirm previous redshift lower limits, while in eight cases a new limit is proposed (see targets D in Table D.2). In Fig. 1, we show the distribution of the redshift and its lower limit for the sample of 27 targets with z > 0.6 (see Table D.2). The average redshift is < z> = 0.93 ± 0.30, and the average redshift lower limit is < z> = 1.08 ± 0.35.
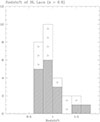 |
Fig. 1. Distribution of the redshift and the spectroscopic lower limits from the distribution of intervening systems of BLLs at z > 0.6. See Table D.2 for details. |
In Table D.3 we report the measurements of all the detected emission lines. For nine objects, we detected [OII] 3727 Å. The average luminosity in these sources is < Log(L[OII]) > = 41.5 ± 0.3 erg/s. This value is very close to the average of the distribution of a collection of ∼70 BLLs at various redshifts (Landoni et al. 2020). In seven sources, we detected the MgII 2800 broad emission line. Of these, the EW is less than or equal to 10 Å in six sources, but in one case (5BZBJ0407+0742) the EW is ∼17 Å. The luminosity of the line is in the range Log(L[MgII]) = 41.7 to 42.9 erg/s.
Given the relatively high redshift of these targets, we frequently detected absorption features originating from intervening systems, mainly the MgII 2800 doublet, FeII 2383 and 2600, and in some cases CIV 1550. Table D.4 summarises the properties of all identified intervening absorbers. Overall, at least one such absorption feature is present in 16 of the 52 observed sources.
The most prominent and commonly detected feature is the MgII 2800 doublet and the corresponding redshift range effectively spans from z ∼ 0.4 to z ∼ 1.7. On average, MgII absorption is found at z ∼ 0.8 ± 0.2, with equivalent widths ranging from 0.3 to 5.7 Å. The incidence and properties of the MgII intervening systems are consistent with the expectations reported by Zhu & Ménard (2013, see also Landoni et al. 2013).
4.2. The continuum spectral shape
For each source we performed a best fit of the continuum, assuming a power-law shape after excluding all telluric absorptions and the emission and/or absorption lines in the spectra of targets. We derived the spectral index α from the fit Fλ ∝ λα (see Table D.2), binning the spectra in intervals of 100 Å. The spectral index covers a range from −2.3 to 0.23 with an average < − 0.82 > ± 0.46 (see Fig. 2). If we consider only the 22 targets of unknown redshift, the average slope becomes < − 1.00 > ± 0.47. No significant difference was found in the whole sample. In only one case, 4FGLJ1151.5-1347, the global slope of the spectrum is positive and not well fitted by a power law.
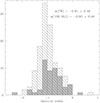 |
Fig. 2. Distribution (filled area) of the spectral index of the optical spectra (4000–7500 Å) of the whole dataset (52 BLLs) of this work (TW) compared with the distribution (shaded area) of 126 other BLLs (see papers by Paiano et al referred in Sect. 1). |
The distribution of the spectral indexes of this dataset is fully consistent with that of other BLLs. In Fig. 2 we show a comparison of the spectral index of the targets in this work with that of 126 BLLs taken from our previous studies, which yield the average optical slope of α = < −0.93 > ± 0.40.
5. Discussion
We obtained optical spectra for 52 BLLs in order to probe their high redshift and characterise the optical properties. For only 14 of these BLLs, our observations confirm the redshift (or a spectroscopic lower redshift limit) previously reported in the literature (see objects labelled A in column 6 of Table D.2). For eight sources, we disproved the literature redshifts and propose a new redshift (labelled C in Table D.2). In six of these cases, we found the new redshift is in the range of 0.7 to 1.5, while in two objects that were suggested at z ∼ 1, we detected features corresponding to a lower value of z in the range of 0.5 to 0.6. In another eight cases, we did not confirm the previous literature values since no features were detected in our good quality GTC spectra at the proposed redshift. However, in all of these cases, we were able to set a spectroscopic lower limit from the detection of the intervening absorption lines (see in Table D.2 the sources labelled D). These redshift lower limits are in the range of 0.66–1.80. For 22 targets the redshift remains unknown since the spectra are lineless.
In the present study, we were able to derive a firm redshift for 18 sources and set lower limits for another 12 objects. It is of interest to compare the redshift distribution at > 0.6 of these objects with that of 57 sources for which a reliable redshift or a lower limit was previously established in the literature (see Sect. 2 and Table D.5). The average of 41 literature redshift is < z> = 0.76 ± 0.18 and the average of 16 redshift lower limit is < z> = 0.98 ± 0.45. These values are close to those reported in this paper for 16 sources (< z> = 0.98 ± 0.30) and 11 lower limits (< z> = 1.08 ± 0.35 ), respectively.
In the top panel of Fig. 3, we show the redshift distribution for the entire sample of 57 objects compared with the distribution from this work. The concentration of objects at 0.6 < z < 1.0 is likely due to selection effects from flux-limited observations. In the bottom panel of Fig. 3, we report the distribution of the redshift lower limits of the entire sample of 27 sources.
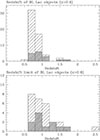 |
Fig. 3. Top: Redshift distribution of 16 BLLs at z > 0.6 from this work (filled area) and from the whole set of 57 objects including this work and those (41) with known z from Table D.5 that are in 4LAC and BZCAT catalogues (shaded area). Bottom: Spectroscopic redshift lower limit distribution of 11 objects from this work with z > 0.6 based on intervening absorption systems compared with the lower limit distribution of all 27 sources (objects in this work plus 16 lower limits in the catalogues 4LAC and BZCAT). |
From this spectroscopic study of high-redshift BLLs, we found nine sources that are at z > 1. For five of them, the redshift or its lower limit was previously known. In our previous study of high-z BLL candidates (Landoni et al 2018), we found six objects at z > 1. Three of them have a lower limit set by Ly α absorption at a very high z (z = 2.47, 3.14 and 3.36).
Finally, for the remaining 22 objects (labelled B in Table D.2), we do not confirm the previous alleged values of the redshift, and our spectra do not exhibit any emission and/or absorption lines in the spectral range 4000–7800 Å. From a careful examination of the spectra reported in the literature, we found that in 21 of these cases the proposed redshift was based on rather uncertain features (see Sect. B). Only in one source, 4FGLJ2206.8-0032, the spectrum by Shaw et al. (2013) of October 2010 reports convincing evidence of an emission line at 5750 Å, which yields z = 1.053. In our spectrum (November 2018), which corresponds to a state slightly higher than the Shaw et al. (2013) spectrum, this line is undetectable up to EW ∼ 0.3 Å. Another similar interesting case is 5BZBJ2134–0153 (see details in Appendix B3). This object was observed by us in 2006 (Landoni et al. 2018) on a flux state that was a factor of five lower than that of the present observation. In the low state, some emission lines are clearly apparent (at z = 1.285), but they are undetected in the spectrum obtained at a higher flux state.
For these 22 sources characterised by featureless spectra, we derived a minimum redshift based on the non-detection of the host galaxy’s spectral signatures. To this end, we first estimated the minimum detectable EW in each spectrum and then applied the procedure described in Paiano et al. (2017c) to obtain a lower limit on the redshift. This method assumes that the observed optical spectrum results from the superposition of a non-thermal power-law component (Fλ ∼ λα) and the stellar emission of an elliptical host galaxy with absolute magnitude M(R) = − 22.9 (Sbarufatti et al. 2005a), as derived from Hubble Space Telescope observations of objects at z < 0.7. Under these assumptions, the detectability of the stellar absorption features depends on the nucleus-to-host flux ratio (N/H). Using the observed magnitude of the source and the minimum EW measurable in the spectrum, we can therefore estimate a lower limit to the redshift.
Since the absolute magnitudes of BLL host galaxies exhibit a dispersion of roughly one magnitude (Sbarufatti et al. 2005a), the computed redshift limits should be regarded as the most probable values. If a host galaxy is 0.5 mag fainter or brighter than assumed, the corresponding redshift limit would increase or decrease by about 0.05–0.1, depending on the redshift. Note that if at z > 0.7 the host were systematically more luminous by ∼0.5 mag, the redshift limits would be even smaller (by about 0.05). The resulting lower limits for the sample are shown in Fig. 4, where we also show the objects with known redshift or with spectroscopic lower limits in the z–r plane (redshift versus r magnitude). The r magnitudes were derived from the de-reddened spectra. For comparison, we plot the expected apparent r magnitude of the ‘average’ host galaxy (including the k correction) as a function of z. We also illustrate the expected total r magnitude (host galaxy plus non-thermal nuclear emission) for several values of N/H in the rest-frame r band.
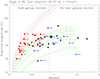 |
Fig. 4. The apparent r magnitude of the targets vs the redshift or their lower limits (arrows). Black squares are the objects with known z. The blue triangles with arrow come from spectroscopic lower limits due to intervening absorption systems. The red filled circles with arrows represent the lower limit of the redshift for objects with featureless spectra. These are based on the assumption they are hosted by a typical giant elliptical, that the non thermal nuclear component is described by a power, and that the CaII absorption features are smaller than the minimum EW of the observed spectra (see text and Paiano et al. (2017c) for more details). The red dashed vertical line yields the limit of the redshift where CaII lines can be detected in the observe spectral range. The solid red line represent the magnitude in the r band of a elliptical galaxy of M(R) = − 22.9 at various redshift. The two similar red dashed lines encompasses the solid line by 1 magnitude. The green dashed lines show the position in the plane z − r of BLL with a standard host galaxy and a non thermal nucleus (α = −1), at different N/H ratio (see text for more details). |
Most targets with a known redshift lie in the region corresponding to N/H values between three and ten. Assuming that the 22 objects with featureless spectra share a similar N/H, these sources would fall within a redshift range of approximately 0.3–1.4 (for an assumed N/H = 5). If these objects indeed lie within that redshift interval, one would expect, given high-quality optical spectra, to detect emission lines such as [O II] 3727 Å, [O III] 5007 Å, and Mg II 2800 Å, unless these features are intrinsically very weak. Based on their minimum detectable EW and the assumed redshift range (0.3–1.4), we estimate that the luminosities of these lines would need to be, on average, lower than log(Lline)≃40.9 (with 40.7 < log(Lline) < 41.0). This is about an order of magnitude fainter than the average line luminosity reported in Table D.3, log(Lline) = 41.9 ± 0.5. Therefore, the possibility to derive their redshift from an emission line would require optical spectra of excellent quality in terms of both S/N and spectral resolution. An alternative approach could rely on the detection of the absorption features from the hosting galaxy. In fact BLLs are generally hosted by giant elliptical galaxies, as confirmed in all well-studied cases. Therefore, one of the most effective strategies to determine the redshift of these sources is to obtain high-quality spectroscopy in the red and near-infrared domains, where the host galaxy contributes a larger fraction of the total flux and its main stellar absorption features become more easily detectable. It is worth noting that this spectral region is affected by numerous telluric absorption features, which can contaminate the observed spectral lines and therefore require careful correction (see also Pita et al. 2014). In addition, the near-infrared background is significantly higher than in the optical regime, thus substantially limiting the achievable S/N of the spectra. Finally we comment on another promising technique for constraining the redshift of high-z sources. This technique relies on the detection of the Lyman break through multi-colour photometry (see e.g. Sheng et al. (2024) and references therein). However, the accuracy and reliability of the resulting redshift estimates are significantly lower than those obtained from spectroscopic line detections.
Data availability
The flux-calibrated and de-reddened spectra are available in our online data base ZBLLAC4.
Acknowledgments
We thank the referee for constructive comments and suggestions. We are grateful to Enrico and Francesco Massaro for clarification on the BZCAT catalogue. This paper made use of the Sloan Digital Sky Survey (SDSS) data releases, and of the NASA/IPAC Extragalactic Database (NED).
References
- Abdollahi, S., Acero, F., Baldini, L., et al. 2022, ApJS, 260, 53 [NASA ADS] [CrossRef] [Google Scholar]
- Ajello, M., Angioni, R., Axelsson, M., et al. 2020, ApJ, 892, 105 [NASA ADS] [CrossRef] [Google Scholar]
- Ajello, M., Baldini, L., Ballet, J., et al. 2022, ApJS, 263, 24 [NASA ADS] [CrossRef] [Google Scholar]
- Álvarez Crespo, N., Domínguez, A., Paliya, V. S., et al. 2025, A&A, 694, A46 [NASA ADS] [CrossRef] [EDP Sciences] [Google Scholar]
- Atwood, W. B., Abdo, A. A., Ackermann, M., et al. 2009, ApJ, 697, 1071 [CrossRef] [Google Scholar]
- Bade, N., Beckmann, V., Douglas, N. G., et al. 1998, A&A, 334, 459 [NASA ADS] [Google Scholar]
- Beckmann, V., Bade, N., & Wucknitz, O. 1999, A&A, 352, 395 [NASA ADS] [Google Scholar]
- Blades, J. C., Murdoch, H. S., & Hunstead, R. W. 1980, MNRAS, 191, 61 [Google Scholar]
- Cardelli, J. A., Clayton, G. C., & Mathis, J. S. 1989, ApJ, 345, 245 [Google Scholar]
- Cepa, J., Aguiar-Gonzalez, M., Bland-Hawthorn, J., et al. 2003, in Instrument Design and Performance for Optical/Infrared Ground-based Telescopes, eds. M. Iye, & A. F. M. Moorwood, SPIE Conf. Ser., 4841, 1739 [NASA ADS] [CrossRef] [Google Scholar]
- Cohen, R. D., Smith, H. E., Junkkarinen, V. T., & Burbidge, E. M. 1987, ApJ, 318, 577 [NASA ADS] [CrossRef] [Google Scholar]
- Drinkwater, M. J., Webster, R. L., Francis, P. J., et al. 1997, MNRAS, 284, 85 [NASA ADS] [Google Scholar]
- Falomo, R., & Kotilainen, J. K. 1999, A&A, 352, 85 [Google Scholar]
- Falomo, R., Pian, E., & Treves, A. 2014, A&ARv, 22, 73 [NASA ADS] [CrossRef] [Google Scholar]
- Giommi, P., & Padovani, P. 2021, Universe, 7, 492 [NASA ADS] [CrossRef] [Google Scholar]
- Giroletti, M., & Bernard, D. 2024, ATel, 16913, 1 [Google Scholar]
- Glikman, E., Helfand, D. J., White, R. L., et al. 2007, ApJ, 667, 673 [NASA ADS] [CrossRef] [Google Scholar]
- Goldoni, P., Pita, S., Boisson, C., et al. 2021, A&A, 650, A106 [NASA ADS] [CrossRef] [EDP Sciences] [Google Scholar]
- Healey, S. E., Romani, R. W., Taylor, G. B., et al. 2007, ApJS, 171, 61 [Google Scholar]
- Healey, S. E., Romani, R. W., Cotter, G., et al. 2008, ApJS, 175, 97 [Google Scholar]
- Hook, I. M., Shaver, P. A., Jackson, C. A., Wall, J. V., & Kellermann, K. I. 2003, A&A, 399, 469 [NASA ADS] [CrossRef] [EDP Sciences] [Google Scholar]
- Kaur, A., Kerby, S., & Falcone, A. D. 2023, ApJ, 943, 167 [Google Scholar]
- Kerby, S., Kaur, A., Falcone, A. D., et al. 2021, ApJ, 923, 75 [NASA ADS] [CrossRef] [Google Scholar]
- Landoni, M., Falomo, R., Treves, A., et al. 2013, AJ, 145, 114 [Google Scholar]
- Landoni, M., Paiano, S., Falomo, R., Scarpa, R., & Treves, A. 2018, ApJ, 861, 130 [Google Scholar]
- Landoni, M., Falomo, R., Paiano, S., & Treves, A. 2020, ApJS, 250, 37 [NASA ADS] [CrossRef] [Google Scholar]
- Landt, H., Padovani, P., Perlman, E. S., et al. 2001, MNRAS, 323, 757 [NASA ADS] [CrossRef] [Google Scholar]
- Lawrence, C. R., Zucker, J. R., Readhead, A. C. S., et al. 1996, ApJS, 107, 541 [NASA ADS] [CrossRef] [Google Scholar]
- Massaro, F., D’Abrusco, R., Tosti, G., et al. 2012, ApJ, 752, 61 [NASA ADS] [CrossRef] [Google Scholar]
- Massaro, E., Maselli, A., Leto, C., et al. 2015, Ap&SS, 357, 75 [Google Scholar]
- Paiano, S., Falomo, R., Franceschini, A., Treves, A., & Scarpa, R. 2017a, ApJ, 851, 135 [NASA ADS] [CrossRef] [Google Scholar]
- Paiano, S., Landoni, M., Falomo, R., Treves, A., & Scarpa, R. 2017b, ApJ, 844, 120 [NASA ADS] [CrossRef] [Google Scholar]
- Paiano, S., Landoni, M., Falomo, R., et al. 2017c, ApJ, 837, 144 [Google Scholar]
- Paiano, S., Falomo, R., Treves, A., & Scarpa, R. 2018, ApJ, 854, L32 [NASA ADS] [CrossRef] [Google Scholar]
- Paiano, S., Falomo, R., Treves, A., Franceschini, A., & Scarpa, R. 2019, ApJ, 871, 162 [NASA ADS] [CrossRef] [Google Scholar]
- Paiano, S., Falomo, R., Treves, A., & Scarpa, R. 2020, MNRAS, 497, 94 [CrossRef] [Google Scholar]
- Paiano, S., Falomo, R., Treves, A., et al. 2021a, MNRAS, 504, 3338 [NASA ADS] [CrossRef] [Google Scholar]
- Paiano, S., Treves, A., Franceschini, A., & Falomo, R. 2021b, MNRAS, 508, 6128 [Google Scholar]
- Paiano, S., Falomo, R., Treves, A., et al. 2023, MNRAS, 521, 2270 [NASA ADS] [CrossRef] [Google Scholar]
- Paiano, S., Falomo, R., Treves, A., & Scarpa, R. 2024, ATel, 16925, 1 [Google Scholar]
- Peña-Herazo, H. A., Amaya-Almazán, R. A., Massaro, F., et al. 2020, A&A, 643, A103 [NASA ADS] [CrossRef] [EDP Sciences] [Google Scholar]
- Piranomonte, S., Perri, M., Giommi, P., Landt, H., & Padovani, P. 2007, A&A, 470, 787 [NASA ADS] [CrossRef] [EDP Sciences] [Google Scholar]
- Pita, S., Goldoni, P., Boisson, C., et al. 2014, A&A, 565, A12 [NASA ADS] [CrossRef] [EDP Sciences] [Google Scholar]
- Plotkin, R. M., Anderson, S. F., Hall, P. B., et al. 2008, AJ, 135, 2453 [NASA ADS] [CrossRef] [Google Scholar]
- Plotkin, R. M., Anderson, S. F., Brandt, W. N., et al. 2010, AJ, 139, 390 [NASA ADS] [CrossRef] [Google Scholar]
- Plotkin, R. M., Markoff, S., Trager, S. C., & Anderson, S. F. 2011, MNRAS, 413, 805 [Google Scholar]
- Rajagopal, M., Kaur, A., Ajello, M., et al. 2020, ApJ, 898, 18 [NASA ADS] [CrossRef] [Google Scholar]
- Rajput, B., Goldoni, P., Max-Moerbeck, W., et al. 2025, A&A, 704, A190 [NASA ADS] [CrossRef] [EDP Sciences] [Google Scholar]
- Rector, T. A., & Stocke, J. T. 2001, AJ, 122, 565 [NASA ADS] [CrossRef] [Google Scholar]
- Rector, T. A., Stocke, J. T., Perlman, E. S., Morris, S. L., & Gioia, I. M. 2000, AJ, 120, 1626 [NASA ADS] [CrossRef] [Google Scholar]
- Sandrinelli, A., Treves, A., Falomo, R., et al. 2013, AJ, 146, 163 [Google Scholar]
- Sbarufatti, B., Treves, A., & Falomo, R. 2005a, ApJ, 635, 173 [NASA ADS] [CrossRef] [Google Scholar]
- Sbarufatti, B., Treves, A., Falomo, R., et al. 2005b, AJ, 129, 559 [NASA ADS] [CrossRef] [Google Scholar]
- Sbarufatti, B., Treves, A., Falomo, R., et al. 2006, AJ, 132, 1 [NASA ADS] [CrossRef] [Google Scholar]
- Schlafly, E. F., & Finkbeiner, D. P. 2011, ApJ, 737, 103 [Google Scholar]
- Shaw, M. S., Romani, R. W., Cotter, G., et al. 2012, ApJ, 748, 49 [CrossRef] [Google Scholar]
- Shaw, M. S., Romani, R. W., Cotter, G., et al. 2013, ApJ, 764, 135 [NASA ADS] [CrossRef] [Google Scholar]
- Sheng, Y., Rajagopal, M., Kaur, A., et al. 2024, ApJ, 964, 63 [Google Scholar]
- Sowards-Emmerd, D., Romani, R. W., & Michelson, P. F. 2003, ApJ, 590, 109 [Google Scholar]
- Stickel, M., Fried, J. W., & Kuehr, H. 1993, A&AS, 98, 393 [NASA ADS] [Google Scholar]
- Stocke, J. T., & Rector, T. A. 1997, ApJ, 489, L17 [Google Scholar]
- Ballet, J., Bruel, P., Burnett, T. H., Lott, B., & The Fermi-LAT collaboration 2023, arXiv e-prints [arXiv:2307.12546] [Google Scholar]
- Tody, D. 1986, in Instrumentation in astronomy VI, ed. D. L. Crawford, SPIE Conf. Ser., 627, 733 [Google Scholar]
- Tody, D. 1993, in Astronomical Data Analysis Software and Systems II, eds. R. J. Hanisch, R. J. V. Brissenden, & J. Barnes, ASP Conf. Ser., 52, 173 [Google Scholar]
- Torrealba, J., Chavushyan, V., Cruz-González, I., et al. 2012, Rev. Mex. Astron. Astrofis., 48, 9 [NASA ADS] [Google Scholar]
- Ulgiati, A., Paiano, S., Treves, A., et al. 2024, MNRAS, 530, 4626 [NASA ADS] [CrossRef] [Google Scholar]
- Ulgiati, A., Paiano, S., Pintore, F., et al. 2025, A&A, 694, A176 [NASA ADS] [CrossRef] [EDP Sciences] [Google Scholar]
- Vermeulen, R. C., Taylor, G. B., Readhead, A. C. S., & Browne, I. W. A. 1996, AJ, 111, 1013 [Google Scholar]
- Zhu, G., & Ménard, B. 2013, ApJ, 770, 130 [NASA ADS] [CrossRef] [Google Scholar]
Appendix A: Optical spectra
The GTC optical spectra of high-z blazar candidates.
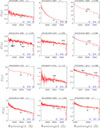 |
Fig. A.1. GTC optical spectra of high-z blazar candidates (see details in Table D.1 and Table D.2 and notes in Appendix B). The redshift of featureless spectra is marked by an asterisk. Flux units :10−16 erg cm2 s−1 Å−1. |
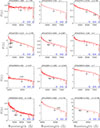 |
Fig. A.1. Continued. |
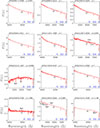 |
Fig. A.1. Continued. |
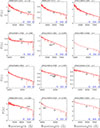 |
Fig. A.1. Continued. |
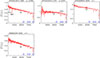 |
Fig. A.1. Continued. |
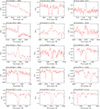 |
Fig. A.2. Selected spectral regions where relevant emission and absorption lines are detected. See also Tables D.3 and D.4 |
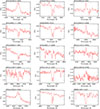 |
Fig. A.2. Continued |
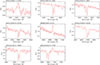 |
Fig. A.2. Continued |
Appendix B: Notes on individual sources
-
4FGL J0038.1+0012: In Sandrinelli et al. (2013), a tentative lower limit of the redshift z > 0.708 is proposed based on a possible intervening absorption feature of MgII 2800. SDSS obtained two spectra (g = 19.7) and proposed z = 0.739 and z = 1.08, but no convincing emission and/or absorption features are clearly visible. Our GTC spectrum was obtained during a faint state (g = 20.2) and is of modest quality (S/N∼15). No emission or absorption lines are found with a limit of EW∼1 Å.
-
4FGL J0047.0+5658: An optical featureless spectrum (g = 18.3) was previously obtained by Shaw et al. (2013) that estimated a lower limit of the redshift (> 0.64) from the absence of host galaxy spectral features. Our spectrum was obtained at a lower flux level (g = 21.1), and no features are detected at EW > 0.5 Å.
-
4FGL J0050.7-0929: In the spectrum obtained by Shaw et al. (2013, g = 18.3), two possible faint narrow emission lines are proposed and identified as [OII] and [OIII] at z = 0.635. Our better quality spectrum (S/N∼370) clearly shows (see Fig. A.2 ) an emission line at 6095 Å (EW = 0.13 Å) that confirms the feature proposed in literature. If identified as [OII] 3727 Å the redshift is z = 0.636. Note that the flux level in our spectrum is a factor ∼ 7 higher that that obtained by Shaw et al. (2013).
-
4FGL J0124.8-0625: In the spectrum obtained by Shaw et al. (2013) many intervening absorption features are visible and identified as CIV 1550 and MgII 2800. A redshift z = 2.117 is proposed based also on the possible identification of Lyα forest. No clear emission features at the above redshift are visible (and identified) in their spectrum. In our GTC spectrum, we clearly detect three narrow absorption features at 4678 Å, 4730 Å, and 4830 Å (EW ∼ 3.5 Å). The most probable identification of these three features is in terms of intervening MgII 2800 systems at z = 0.672, 0.690 and 0.726 (see Fig. B.1). These absorption lines are also visible in the spectrum obtained by Shaw et al. (2013), but identified as CIV 1550. In our spectrum, another weaker absorption doublet is present at 6197 Å. If identified as MgII 2800 Å, the intervening system would be z = 1.216. Thus this source is at z > 1.216.
-
4FGL J0148.6+0127: The spectrum obtained by Shaw et al. (2013) is well described by a power law shape. From two spikes identified as [OII] and [OIII] they proposed z = 0.94. In our spectrum (S/N∼30), we confirm the detection of a narrow emission line at 7240 (EW∼ 3 Å). In addition, we also detect a possible weak emission at 5445 Å. These emission lines are identified as [OII] 3727 and MgII 2800, respectively, at z = 0.944.
-
4FGL J0153.9+0823: In the Shaw et al. (2013) spectrum, the authors noted two emission lines at ∼8416 Å identified as [OIII] at z = 0.681. These lines are out of observed range of our GTC spectrum, but we clearly detect a narrow emission at 6272 Å (EW = 0.6 Å) that corresponds at the [OII] 3727 Å emission line at the same redshift proposed in literature. Thus this redshift appears well established from two narrow emission lines.
-
4FGL J0303.6+4716: This source is heavily reddened with the E(B-V) = 0.22. In a spectrum extending to shorter wavelength down to ∼3500, Shaw et al. (2013) reports an absorption doublet at ∼3840 Å that could be identified as MgII 2800. This sets a redshift lower limit of the source at z > 0.37. In our good S/N∼250 optical spectrum, we do not detect clear emission or absorption lines down to EW > 0.2 Å in the observed spectral range. Note that the intervening feature reported by Shaw et al. (2013) is outside our observed range.
-
4FGLJ0407.5+0741: This source is heavily reddened with the E(B-V) = 0.23. Sowards-Emmerd et al. (2003) obtained two optical spectra of the source in two different states that appeared very different in shape and weak features. They consider the value z = 1.133 from the lower state spectrum to be the most reliable. Our very modest quality (S/N∼15) spectrum of the target (g = 20.8) shows only one broad emission line (EW = 22 Å) at 5990 Å that, if identified as MgII 2800, yields z = 1.141.
-
4FGL J0434.1-2014: The spectrum obtained by Shaw et al. (2013) is well described by a power law shape. Weak emission lines were detected and identified as MgII 2800 and [OII] 3727 at z = 0.928. In our GTC spectrum, we detect and confirm these two emission lines at 5400 Å and 7182 Å with EW = 2.5 Å and 1.7 Å respectively, consistent with the a redshift of z = 0.928.
-
4FGL J0501.0+2424: This BLL is reported in the 4FGL and 3FHL catalogue. The source has an unknown redshift and it was studied in the optical-UV band by Sheng et al. (2024). This source is heavily reddened ( E(B-V) = 0.44 ). No previous optical spectra of the source are found. We obtained an optical spectrum at the GTC that appears featureless with a limit of EW of lines EW > 2 Å.
-
4FGLJ0509.6+8425: The source, also known as S5 0454+84, is listed in the BZCAT catalogue with a reported redshift of z > 1.34, based on the detection of an intervening MgII 2800 absorption system at ∼6550 Å (Stocke & Rector 1997). Our GTC optical spectrum (g = 19.1) is well described by a power law continuum with spectral index α∼-0.3. No emission line (EW > 3 Å) are detected. We confirm the presence of a very weak MgII 2800 absorption doublet at z = 1.340.
-
4FGL J0525.8-0052: In the 4LAC catalogue, the source is reported to have a redshift of z = 1.2, although no reference of spectroscopy is available. Our GTC optical (r = 18.5) spectrum is well fitted by a power law shape with spectral index α∼-0.6, and no emission and/or absorption lines (EW > 3 Å) are detected.
-
4FGL J0629.3-1959 The spectrum obtained by Shaw et al. (2013) exhibits many intervening absorption line systems. Based on a weak emission feature at ∼4225 Å, identified as CIV 1550 Å, they proposed a redshift of z = 1.724. In our GTC optical spectrum, we confirm the emission feature at 4235 Å (EW > 5 Å). This emission is blended with a strong narrow absorption line at 4220 Å In addition, we detect another weak emission line at 5202 Å (EW > 2.5 Å). These two weak lines are identified as CIV 1550 and CIII] 1909, respectively, yielding a redshift of z = 1.730 for the source. Furthermore, several intervening absorption system are detected at 4162, 4220, 4555 Å, ad well as at 6390, 6495, 7050, and 7088 Å. If the absorption features observed at λ> 4500 Å are interpreted as MgII 2800 systems, they correspond to intervening absorbers at redshift between 0.63 and 1.53, consistent with the emission redshift z = 1.730.
-
4FGL J0706.8+7742: In the power-law continuum obtained by Shaw et al. (2013), no features were detected, and a lower limit of z > 0.39 was proposed. Our high quality (S/N∼300) GTC spectrum is also dominated by a power law continuum (α∼-1) and appears featureless up to 7700 Å.
-
4FGL J0727.1+3734: The automatic SDSS analysis of the optical spectrum suggests a redshift of z = 0.872, based on a single broad emission line at ∼7240 Å, attributed to [NeIII] 3869 Å. Landoni et al. (2018) proposed a redshift z = 0.791 on the basis of an absorption doublet at lambda 7043-7107 Å identified with CaII 3934-3968. With the present spectrum we confirm the CaII doublet (EW∼3 Å). Moreover we detect an additional absorption feature at 7348 corresponding to Hδ at the same redshift. No emission lines are apparent.
-
4FGL J0733.7+4110: The SDSS spectrum tentatively suggests a redshift of z = 0.19. However, no clear emission features are visible to justify this value. Our optical spectrum clearly shows a number of absorption features in the spectral range 4200 to 4900 Å. The most prominent lines are at 4333 Å (EW = 3.2 Å), 4458 Å (EW 5.7 Å) and 4560 Å (EW 3.1 Å). They are also visible in the SDSS spectrum, which, although noisier than the GTC spectrum, allows us to better resolve the features that are doublets in all cases (see Fig. B.2). We identify these doublets as intervening absorption systems due to one CIV 1550 and two MgII 2800 at redshifts z = 1.797, 0.594, and 0.629. Three additional weaker absorption lines are detected at 4393, 4492 and 4808 Å, but their identification remains unknown. Based on these features, we can set a lower limit on the source redshift of z > 1.797. Note that at this high z, the source becomes very luminous (Mg< –27.2)
-
4FGL J0753.0+5353: In the optical spectrum reported by Shaw et al. (2013), no significant emission and/or absorption features were detected, and a lower limit of z > 0.42 is proposed. In our GTC spectrum, we clearly detect a broad emission line at 5394 Å, which, if attributed to MgII 2800, corresponds to a redshift z = 0.927. Additionally, we identify an intervening MgII absorption doublet at 5176 Å, associated with a system at z = 0.851.
-
4FGL J0754.4-1148: Based on a featureless optical spectrum, Shaw et al. (2013) proposed a lower limit to z > 0.37 for the source. Our optical spectrum shows a continuum well described by a power law shape and it is featureless. No lines are detected down to EW > 0.5 Å.
-
4FGL J0800.9+4401: The spectrum presented by Shaw et al. (2013) shows no detectable spectral features, from which a lower limit of z > 0.51 was derived. Two independent spectra, obtained by the SDSS, report tentative redshift estimates of z = 1.07 (DR7) and z = 1.38 (DR16). However, neither displays convincing spectral features to support these values. In our GTC spectrum, a narrow emission line is detected at 5852 Å. The most plausible identification is with [OII] 3727 Å, corresponding to a redshift z = 0.57. An alternative identification of this feature as [O III] λ5007 is ruled out by the S/N: The primary line is sufficiently intense that the secondary [O III] component at λ4959 would have been clearly detected. This redshift needs further confirmation from other lines.
-
4FGLJ0801.1+1335: An optical spectrum provided by SDSS is noisy and featureless, exhibiting a power law continuum. The BZCAT catalogue lists a redshift of z = 1.042. Our GTC spectrum reveals an absorption doublet at 5360 Å, identified as an MgII 2800 intervening system at z = 0.916. No emission lines with EW > 2 Å are found, setting a lower limit on the redshift of the source of z > 0.916.
-
4FGLJ0823.3+2224: A redshift z = 0.951 was previously proposed based on a single emission line at ∼5460 Å interpreted as MgII 2800 in a low S/N spectrum (Stickel et al. 1993). In our high quality (S/N∼140) optical spectrum, the emission feature is not confirmed, and no lines with EW > 1 Å are detected across the observed range. The redshift of the source therefore remains undetermined.
-
5BZB J0839+0319: This target (also known as PKS0837+035 ) was observed by Drinkwater et al. (1997). An uncertain redshift z = 1.57 is reported, with no spectral features identified. Our GTC spectrum is characterised by a power law continuum and shows a clear absorption doublet at 5220 Å, identified as intervening MgII 2800 at z = 0.864. A weaker absorption feature is also detected at 4440 Å, which we attribute to FeII at the same redshift. These absorptions set a lower limit on the source redshift of z > 0.864. No clear emission lines are detected at the previously proposed tentative redshift z = 1.57.
-
4FGL J0849.5+0456: The SDSS automatic analysis of the optical spectrum provides tentative redshift estimates of z = 1.07 (DR7) and z = 1.22 (DR16), but no convincing spectral features are evident. In our GTC spectrum, we detect a narrow emission line at 6500 Å (EW = 0.7 Å) that if interpreted as [OII] 3727 Å, corresponds to z = 0.744. An alternative identification of this feature could be as [O III] λ5007. In this case we would expect to detect also the secondary [O III] component at λ4959.
-
4FGL J0902.4+2051: A tentative redshift of z = 1.52 has been proposed from the SDSS spectrum, although no convincing emission/absorption lines are present. Our GTC spectrum displays a smooth continuum consistent with a power-law shape (α∼-0.7) and reveals a clear absorption doublet at 4770 Å. We interpret this feature as the intervening MgII 2800 Å doublet at z = 0.706, which sets a lower limit to the source redshift of z > 0.706.
-
4FGL J0921.7+2336: The SDSS spectrum appears featureless, though a highly uncertain redshift of z = 1.38 was suggested. Our higher quality (S/N∼200) GTC data confirm that the optical spectrum remains featureless across the 3770–7750 Å range, with the exception of two faint absorption features (EW∼0.5 Å) at 6006 and 6060 Å. These lines are consistent with the CaII doublet and may originate from the host galaxy at z = 0.527, or alternatively from an intervening absorber. However, no nearby galaxies are evident in the field that could be responsible for the absorption. This redshift needs further confirmation from other lines.
-
4FGLJ0926.4+5412: A tentative redshift of z = 0.852 was reported from the SDSS spectrum. The GTC optical spectrum (S/N∼50) shows a featureless power law continuum (α∼–1) with no lines detected above EW > 1 Å.
-
4FGL J1007.0+3455: The BZCAT catalogue lists a tentative redshift of z = 0.612. The only available optical spectrum, in literature from SDSS, is featureless with a continuum following a power law shape. Our higher quality GTC spectrum (S/N∼70) confirms the absence of any detectable features with EW > 0.7 Å. The continuum is well fitted by a power law with spectral index α = –1.3.
-
4FGL J1054.5+2211: A featureless optical spectrum reported by Shaw et al. (2013, g = 17.5) led to a lower redshift limit of z > 0.51. Two additional spectra obtained by SDSS (DR7 and DR16) are also featureless. The object was also observed by Álvarez Crespo et al. (2025) in September 2023 (R = 17.2), and no lines were detected. Our GTC observations (g = 17.6) confirm the absence in the optical spectrum of any spectral lines (EW > 0.3 Å), with the continuum well described by a power law shape. It is worth noting that the available SDSS spectra exhibit a significant flux variability.
-
4FGLJ1110.5-1836: A redshift of z = 1.56 was estimated by Rajagopal et al. (2020) using a photometric technique based on six Swift/UVOT filters and the SDSS griz optical filters on the SARA–CTIO telescope. A featureless optical spectrum was obtained by Shaw et al. (2013), suggesting a lower limit z > 0.5. Our GTC data confirms the featureless nature of the optical spectrum, with EW < 0.8 Å for the lines across the observed range. The continuum is well described by a power law (α∼–1).
-
4FGLJ1132.7+0034: An uncertain redshift of z = 1.14 was suggested from the SDSS-DR16 spectrum. In another optical spectrum obtained by Shaw et al. (2013), a narrow emission line at ∼6250 Å was identified as [OII] at z = 0.678, with a fainter emission feature at 8400 Å attributed to [OIII] at the same redshift. Our GTC spectrum is dominated by a power law continuum. We confirm the [OII] emission at 6252 Å with EW = 0.8 Å, while the [OIII] line falls outside our observed spectral range. Additionally, weak CaII absorption lines from the host galaxy are detected. Thus we confirm the redshift is z = 0.678.
-
4FGL J1151.5-1347: The spectrum reported by Shaw et al. (2013) shows many narrow absorption features superimposed on a power law continuum. A lower redshift limit of z > 0.838 was suggested based on an intervening MgII system at ∼5150 Å. Our GTC spectrum confirms the presence of this MgII absorber at z = 0.838. At the same redshift we detect FeII at 4380 and 4779 Å. In addition, other absorption features are detected at 4310, 4755, 4958 and 5245 Å, although their identification remains unknown.
-
4FGL J1155.8+6137: The 4LAC catalogue lists a redshift of z = 1.5. The SDSS optical spectrum shows a featureless continuum well described by a power law. Our GTC observations confirm the absence of detectable lines, with the continuum remaining featureless and following a power law shape. No emission or absorption features are detected with EW > 0.5 Å.
-
4FGL J1215.1+5002: Although the optical spectrum presented by Shaw et al. (2013) is featureless, it provides a lower limit on the redshift of z > 0.54. Two further SDSS spectra also appear without significant lines. Our high-quality GTC spectrum (S/N∼160) reveals a featureless continuum well described by a power law. No emission or absorption lines with EW > 0.5 Å are detected across the observed wavelength range.
-
4FGL J1302.8+5748: A redshift z = 1.088 is given by Healey et al. (2008) but no spectra are shown. In our GTC optical spectrum, we detect a weak broad emission line at 5844 Å (EW∼7 Å), accompanied by another broad emission at 3962 Å and a fainter feature at 4850 Å. The three emission lines are identified as MgII, CIII] and CII] respectively, consistent with a redshift of z = 1.088.
-
4FGL J1303.0+2434: A redshift z = 0.993 is reported in Glikman et al. (2007), although no reference to the spectrum is provided. In our GTC spectrum, we clearly detect a broad emission line (EW = 2.5 Å) at 5572 Å, which we identify as MgII 2800 Å, confirming the redshift of z = 0.993. An absorption doublet is also detected at 4945 Å, attributed to an intervening MgII 2800 system at z = 0.768. Two additional absorption lines (EW = 0.3 Å) of the same system are detected at 4213 and 4599 Å from FeII 2383 and FeII 2600, respectively. The spectral shape is well described by a power law with spectral index α∼-0.9.
-
4FGLJ1312.4-2156: The optical spectrum obtained by Blades et al. (1980) revealed two intervening absorption systems at z = 1.1361 and z = 1.489, both attributed to CIV 1550. Shaw et al. (2013) later suggested a tentative redshift z = 1.6 based on a very weak feature at ∼7280 Å attributed to Mg II 2800. In our high-quality spectrum (S/N∼190), we do not confirm this line, which would in any case be strongly affected by the telluric absorption band near 7200 Å. No emission features are detected above EW > 0.3 Å. We clearly detect a narrow, strong absorption line at 3855 Å (EW ∼ 10 Å), confirming the presence of the intervening system at z = 1.49. The continuum follows a power-law shape with a spectral index of α∼-0.4.
-
5BZB J1423+1412: A redshift z = 0.768 was proposed for SDSSJ142330.7+141247 from a SDSS noisy spectrum, although no clear emission features are visible. Our GTC optical spectrum does not confirm the value. We detect a broad emission line at 7109 Å, but the detection remains somewhat uncertain because it is partially contaminated by the telluric absorption. If this feature corresponds to MgII 2800, the redshift is z = 1.53. In addition, a distinct clear absorption line is also found at 4203 Å, which is most likely due to an intervening MgII 2800 at z = 0.501.
-
5BZB J1437+4717: From the very noisy SDSS spectrum of SDSSJ143716.1+471726, a redshift of z = 0.943 was suggested. Our GTC spectrum is dominated by a power law continuum (α∼-1.1), with no significant spectral features detected with EW > 1.5 Å. The redshift of the source therefore remains unknown.
-
4FGL J1438.6+1205: The SDSS automatic analysis of the optical spectrum suggests a possible weak emission at about 4200 Å. This feature yields a redshift of z = 0.847, if identified as CII]. We do not confirm this feature in our GTC spectrum therefore, the redshift of the source is unknown.
-
4FGL J1500.7+4752: A tentative redshift z = 1.059 is reported in a note of the NED, based on an unpublished paper by Vermeulent et al. (1996), where two emission lines identified as MgII and [OII]. In our GTC spectrum, we detect only a weak emission line at 5765 Å (EW∼ 3 Å), which, if attributed to MgII 2800, confirms the proposed redshift of z = 1.059. The continuum is rather flat, with a spectral index of α = –0.2.
-
4FGL J1503.3+1651: This source was observed at two different epochs by the SDSS. From these spectra, uncertain redshifts of z = 0.822 (DR7) and z = 0.678 (DR16) were suggested, although no significant emission or absorption lines are clearly visible at the proposed redshift. Note also that the GTC spectrum was obtained at a flux level that is a factor ∼ 1.7 higher than that obtained by SDSS. Our GTC optical spectrum is characterised by a linear continuum without detectable emission lines with EW > 0.5 Å. Conversely, several intervening absorption systems are detected at 4694, 5122, and 5508 Å, corresponding to FeII 2383, FeII 2600 and MgII 2800 at z = 0.970. Additional three intervening absorption features are present at 4620, 4680, and 5097 Å with EW = 1.1, 0.6, and 0.7 Å, respectively; the latter two are consistent with FeII at z = 0.970. From careful inspection of the DR 16 SDSS spectrum these absorption doublets are also visible. The absorption systems set for the target a lower redshift limit of z > 0.970.
-
4FGL J1509.7+5556: The optical spectra obtained by Shaw et al. (2013) and by the SDSS are both featureless, with Shaw et al. (2013) proposing a redshift lower limit of z > 0.5. Our high quality GTC spectrum (S/N∼200) likewise shows no detectable spectral features down to EW > 0.2 Å across the entire observed wavelength range. The continuum is featureless and well represented by a power law with spectral index α = -1.2.
-
4FGL J1529.2+3812: Both SDSS spectra appear featureless, and no reliable redshift determination is available. Our GTC spectrum displays a linear continuum described by a power law shape (α∼-1.1) without any evident emission or absorption lines. Consequently, the redshift of the source remains unknown.
-
4FGL J1530.9+5736: Two SDSS optical spectra are available, but neither shows identifiable spectral features. Our GTC spectrum reveals a continuum well described by a power law (α∼–0.7) and no detectable emission lines with EW > 0.5 Å. However, we clearly detect an absorption system that includes MgII 2800 and FeII 2600, corresponding to at z = 1.0727. This establishes a lower limit to the redshift of this target at z > 1.073.
-
4FGL J1549.6+1710: A low quality optical spectrum was obtained by the SDSS and no convincing emission or absorption lines are found. Our GTC spectrum (S/N∼80) is characterised by a featureless continuum, well described by a power law shape with spectral index of α∼-0.6. No spectral features with EW limit > 0.5 Å are detected.
-
5BZB J1555+2141: Two SDSS spectra obtained for SDSSJ155500.5+214159 suggest tentative redshifts of z = 0.8645 (DR7) and z = 0.802 (DR16). Our GTC spectrum exhibits a power law continuum with α∼-0.9. A weak emission line is detected at 6947 Å, although it is partially contaminated by the telluric absorption band. This feature is also marginally visible in the SDSS spectra. If interpreted as [OII] 3727 Å, it corresponds to a redshift of z = 0.864. In Fig. A.2 we show this feature after correction of the telluric absorption.
-
4FGL J1559.9+2319: From a noisy SDSS spectrum, an uncertain redshift z = 1.034 was suggested but no clear emission/absorption features are visible. In our very good spectrum (S/N∼ 250), we detect an intervening MgII 2800 absorption doublet at 4344 Å, establishing a lower limit on the redshift of z > 0.554. No emission lines are observed down to EW > 0.3 Å.
-
4FGL J1630.7+5221: Shaw et al. (2013) reported a featureless spectrum, setting a lower redshift limit of z > 0.43. We confirm the absence of any spectral features in out GTC optical spectrum with a limit of any absorption or emission line at EW > 0.3 Å.
-
4FGL J2145.5+1006: A tentative redshift z = 0.665 is given from the noisy SDSS-DR16 spectrum, although no clear emission/absorption features are correctly identified. Our GTC spectrum is characterised by a power law continuum with distinct absorption systems at z = 0.661, attributed to intervening MgII 2800 Å and FeII 2600 Å material. Another absorption feature is detected at 4297 Å, located near the FeII 2600 Å line. These features indicate that the redshift of the source is z > 0.661.
-
4FGL J2152.5+1737: The spectrum presented by Shaw et al. (2013) is well described by a power law continuum. In that noisy spectrum, a possible weak emission is found at ∼5247 Å and identified as MgII 2800 Å yielding z = 0.874. In our GTC spectrum, the MgII 2800 line is not detected. However, a narrow emission is tentatively observed at 6970 Å. If identified as [OII] 3727, this line implies a redshift of z = 0.870.
-
4FGL J2206.8-0032: A spectrum obtained by Shaw et al. (2013, g = 19.1) exhibits a power law continuum with an emission feature at ∼5750 Å that was identified as MgII 2800 at z = 1.053. In our GTC spectrum (g = 19.3), we do not confirm this emission line. At its expected wavelength, we set an upper limit of EW < 0.3. Thus, our data indicate a featureless spectrum.
-
5BZB J2339+0534: A tentative redshift of z = 0.74 is provided for MS2336.5+0517 by Rector et al. (2000). Our GTC optical spectrum exhibits a power law continuum and it is featureless with a minimum EW = 1.0 Å. This object was resolved in an optical image obtained by Falomo & Kotilainen (1999). From image decomposition the host galaxy has a magnitude r = 18.6 and an effective radius Re = 0.6 arcsec. Assuming the host galaxy is a typical BLL host galaxy (see e.g. Sbarufatti et al. 2005a) the redshift of this source would be in the range 0.4 to 0.6.
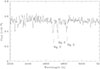 |
Fig. B.1. Blue region of the GTC optical spectrum of 4FGL J0124.8-0625. Three absorption features (EW ∼ 3.5 Å) are clearly detected. The most probable identification of these features is intervening MgII 2800 at z = 0.67-0.72 |
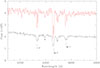 |
Fig. B.2. GTC optical spectrum of 4FGL J0733.7+4110 (black line) in the blue region compared with that obtained by SDSS. The three main absorption features in the range 4200-4600 Å are clearly doublets that support the identification as CIV 1550 and MgII 2800 intervening systems (see text for details). |
Appendix C: Extra targets
We are reporting here spectroscopy of three additional BLL that do not satisfy the selection criteria but were obtained during the same observation run because of particular interest.
C.1. 5BZBJ1107+5010
This target ( SDSSJ110704.8+501038) appears as a BLL in the BZCAT, however, no detection at high energy (gamma and X-ray) was found. In a noisy spectrum obtained by SDSS a redshift z = 0.705 was proposed superposed onto a rather flat optical continuum. We obtained an optical spectrum that confirms this redshift based mainly on the clear detection of the CaII H and K absorption doublet at 6710, 6770 Å and G band. These two lines are particularly strong with EW = 7.8 and 6.8 Å for K and H, respectively (see Fig. C.1 ). To explain the strength of these lines the host galaxy would be rather luminous ( M(R)∼ -23.2 ) and the nucleus/host flux ratio ∼ 0.5 at wavelength close to CaII absorption lines. Moreover, the slope of the spectral slope would be rather steep (α∼ -3).
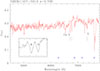 |
Fig. C.1. GTC optical spectrum of the BLL 5BZBJ1107+5010. A strong absorption doublet of CaII and G band are detected at z = 0.705. In the inset box a zoom of the CaII doublet is shown. |
C.2. 4FGL J1824.1+5651
This source is a historically known blazar (see e.g. Healey et al. 2007). An initial redshift of z = 0.663 was proposed by Lawrence et al. (1996) and later confirmed by Stickel et al. (1993) through the detection of weak broad Mg II and narrow [O II] λ3727 Å emission lines. Additional optical spectra obtained by Shaw et al. (2012) and Torrealba et al. (2012) confirmed the presence of these lines and the corresponding redshift. The source exhibited a significant increase in gamma-ray activity in November 2024 (see Giroletti & Bernard 2024). We obtained spectroscopic observations with GTC (see Paiano et al. 2024), clearly detecting the broad Mg IIλ2800 Å line (EW = 3.5 Å) and the narrow [O II] λ3727 Å line. Two additional emission lines are identified at 5703 Å and 6439 Å, corresponding to [Ne V] λ3426 and [Ne III] λ3869, respectively. From these features, we determine a firm redshift z = 0.6645. We also find an intervening absorption system due to MgII 2800 at z = 0.601 (see Fig. C.2).
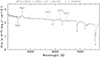 |
Fig. C.2. GTC optical spectrum of 4FGL J1824.1+5651 (4C +56.27). Broad and narrow emission lines at detected at z = 0.6645. Also an intervening absorption system of MgII 2800 is observed at z = 0.601. |
C.3. 4FGL2134.2-0154
An optical spectrum obtained by Sbarufatti et al. (2006) confirmed the redshift z = 1.285 proposed by Rector & Stocke (2001) and Drinkwater et al. (1997). The redshift was based mainly on emission lines of CIII] 1909 and MgII 2800. We observe this target in 2018 October since it was about a factor ∼ 5 brighter than at the observation of 2004 by Sbarufatti et al. (2006). Our GTC spectrum is characterised by a power law continuum. No clear absorption or emission lines are apparent with EW greater than 2.5 Å. It is of interest to compare this spectrum, with that obtained by Sbarufatti et al. (2006, see our Fig. C.3). In the latter spectrum, three emission lines are visibile yielding z = 1.283. The strongest emission line is that of CIII] 1909 at ∼ 4360 Å (EW∼4.5 Å). In the GTC spectrum obtained in the higher state, this feature is barely visible and the EW is less than 2 Å (see Fig. C.3). On the other hand, the continuum shape is very similar (power law spectral index is α = -0.15 ( in 2018) and α = -0.20 (in 2004).
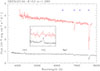 |
Fig. C.3. GTC optical spectrum (upper red spectrum) of 5BZBJ2134-0153 obtained in 2018 compared with thatobtained in 2004 by Sbarufatti et al. (2006, lower black spectrum). An increase by a factor 5 in flux is detected while the line fluxes are reduced by a factor > 4. The inset box shows a zoom of the CIII] emission line in the two spectra. |
Appendix D: Tables
Sample of high-z candidate blazars.
Results from GTC spectroscopy.
Emission line measurements of BLLs.
Intervening absorption lines.
Sample of 57 BLL with reliable literature spectra.
All Tables
All Figures
|
Fig. 1. Distribution of the redshift and the spectroscopic lower limits from the distribution of intervening systems of BLLs at z > 0.6. See Table D.2 for details. |
| In the text | |
|
Fig. 2. Distribution (filled area) of the spectral index of the optical spectra (4000–7500 Å) of the whole dataset (52 BLLs) of this work (TW) compared with the distribution (shaded area) of 126 other BLLs (see papers by Paiano et al referred in Sect. 1). |
| In the text | |
|
Fig. 3. Top: Redshift distribution of 16 BLLs at z > 0.6 from this work (filled area) and from the whole set of 57 objects including this work and those (41) with known z from Table D.5 that are in 4LAC and BZCAT catalogues (shaded area). Bottom: Spectroscopic redshift lower limit distribution of 11 objects from this work with z > 0.6 based on intervening absorption systems compared with the lower limit distribution of all 27 sources (objects in this work plus 16 lower limits in the catalogues 4LAC and BZCAT). |
| In the text | |
|
Fig. 4. The apparent r magnitude of the targets vs the redshift or their lower limits (arrows). Black squares are the objects with known z. The blue triangles with arrow come from spectroscopic lower limits due to intervening absorption systems. The red filled circles with arrows represent the lower limit of the redshift for objects with featureless spectra. These are based on the assumption they are hosted by a typical giant elliptical, that the non thermal nuclear component is described by a power, and that the CaII absorption features are smaller than the minimum EW of the observed spectra (see text and Paiano et al. (2017c) for more details). The red dashed vertical line yields the limit of the redshift where CaII lines can be detected in the observe spectral range. The solid red line represent the magnitude in the r band of a elliptical galaxy of M(R) = − 22.9 at various redshift. The two similar red dashed lines encompasses the solid line by 1 magnitude. The green dashed lines show the position in the plane z − r of BLL with a standard host galaxy and a non thermal nucleus (α = −1), at different N/H ratio (see text for more details). |
| In the text | |
|
Fig. A.1. GTC optical spectra of high-z blazar candidates (see details in Table D.1 and Table D.2 and notes in Appendix B). The redshift of featureless spectra is marked by an asterisk. Flux units :10−16 erg cm2 s−1 Å−1. |
| In the text | |
|
Fig. A.1. Continued. |
| In the text | |
|
Fig. A.1. Continued. |
| In the text | |
|
Fig. A.1. Continued. |
| In the text | |
|
Fig. A.1. Continued. |
| In the text | |
|
Fig. A.2. Selected spectral regions where relevant emission and absorption lines are detected. See also Tables D.3 and D.4 |
| In the text | |
|
Fig. A.2. Continued |
| In the text | |
|
Fig. A.2. Continued |
| In the text | |
|
Fig. B.1. Blue region of the GTC optical spectrum of 4FGL J0124.8-0625. Three absorption features (EW ∼ 3.5 Å) are clearly detected. The most probable identification of these features is intervening MgII 2800 at z = 0.67-0.72 |
| In the text | |
|
Fig. B.2. GTC optical spectrum of 4FGL J0733.7+4110 (black line) in the blue region compared with that obtained by SDSS. The three main absorption features in the range 4200-4600 Å are clearly doublets that support the identification as CIV 1550 and MgII 2800 intervening systems (see text for details). |
| In the text | |
|
Fig. C.1. GTC optical spectrum of the BLL 5BZBJ1107+5010. A strong absorption doublet of CaII and G band are detected at z = 0.705. In the inset box a zoom of the CaII doublet is shown. |
| In the text | |
|
Fig. C.2. GTC optical spectrum of 4FGL J1824.1+5651 (4C +56.27). Broad and narrow emission lines at detected at z = 0.6645. Also an intervening absorption system of MgII 2800 is observed at z = 0.601. |
| In the text | |
|
Fig. C.3. GTC optical spectrum (upper red spectrum) of 5BZBJ2134-0153 obtained in 2018 compared with thatobtained in 2004 by Sbarufatti et al. (2006, lower black spectrum). An increase by a factor 5 in flux is detected while the line fluxes are reduced by a factor > 4. The inset box shows a zoom of the CIII] emission line in the two spectra. |
| In the text | |
Current usage metrics show cumulative count of Article Views (full-text article views including HTML views, PDF and ePub downloads, according to the available data) and Abstracts Views on Vision4Press platform.
Data correspond to usage on the plateform after 2015. The current usage metrics is available 48-96 hours after online publication and is updated daily on week days.
Initial download of the metrics may take a while.