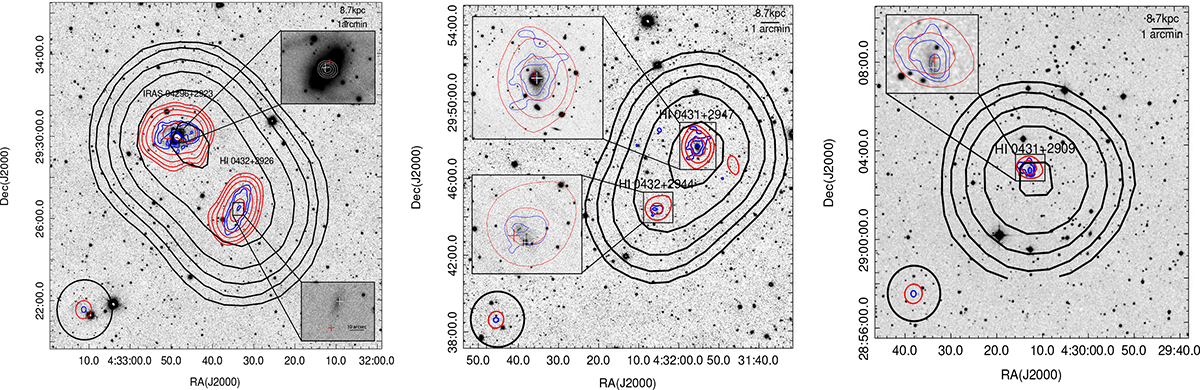
Fig. 1.
Download original image
H I emission contours overlaid on Pan-STARRS optical images of IRAS 04296+2923 and its galaxy group members. Red, blue, and black contours represent the combined H I total intensity (moment 0) maps from the VLA D-array, VLA C-array, and FAST observations, respectively. White contours in the upper left panel indicate central H I absorption toward IRAS 04296+2923 as detected in the VLA C-array data. For the left panel, the contour levels are: red: 0.03, 0.06, 0.12, 0.24, 0.48, 0.96, 1.30, and 1.54 Jy beam−1 km s−1; blue: 0.09, 0.18, and 0.36 Jy beam−1 km s−1; black: 0.10, 0.20, 0.40, 0.80, 1.60, and 3.20 Jy beam−1 km s−1; white (absorption): −0.30, −0.40, −0.50, and −0.60 Jy beam−1 km s−1. For the remaining panels, the contour levels are: red: 0.40, 0.80, and 1.60 Jy beam−1 km s−1; blue: 0.18, 0.36, and 0.72 Jy beam−1 km s−1; black: 0.10, 0.20, 0.40, 0.80, 1.60, and 3.20 Jy beam−1 km s−1. In all panels, the lowest contour corresponds to the 3σ level. White and red crosses mark the optical and H I centroid positions of the detected sources listed in Table 3. Insets show zoomed-in optical views of the individual galaxies. The lower left inset indicates the synthesized beam sizes for each dataset (see Table 1 for beam parameters).
Current usage metrics show cumulative count of Article Views (full-text article views including HTML views, PDF and ePub downloads, according to the available data) and Abstracts Views on Vision4Press platform.
Data correspond to usage on the plateform after 2015. The current usage metrics is available 48-96 hours after online publication and is updated daily on week days.
Initial download of the metrics may take a while.