| Issue |
A&A
Volume 709, May 2026
|
|
|---|---|---|
| Article Number | A149 | |
| Number of page(s) | 18 | |
| Section | Extragalactic astronomy | |
| DOI | https://doi.org/10.1051/0004-6361/202558393 | |
| Published online | 12 May 2026 | |
H I 21-cm line properties of the nearby luminous infrared galaxy IRAS 04296+2923
1
College of Physics, Guizhou University, 550025 Guiyang, PR China
2
National Astronomical Observatories, Chinese Academy of Sciences, Beijing 100101, China
3
Guizhou Radio Astronomical Observatory, Guizhou University, Guiyang 550000, China
★ Corresponding author: This email address is being protected from spambots. You need JavaScript enabled to view it.
Received:
4
December
2025
Accepted:
9
March
2026
Abstract
We present an analysis of archival Very Large Array (VLA) and Five-hundred-meter Aperture Spherical radio Telescope (FAST) H I 21 cm data, together with archival multiband radio continuum observations, of the nearby luminous infrared galaxy (LIRG) IRAS 04296+2923. The system, located behind the Taurus dark cloud at a distance of ∼29 Mpc, forms a small galaxy group consisting of five members as revealed by the H I imaging. IRAS 04296+2923 has a close companion, HI 0432+2926, with a projected separation of ∼40 kpc, a small line-of-sight velocity difference of Δv = 26 km s−1, and comparable total H I masses on the order of 109 M⊙. Both galaxies exhibit regular H I velocity fields and characteristic double-horn profiles in the VLA and FAST data, accompanied by only subtle asymmetries and extended H I structures, indicating rotation-dominated kinematics with early signs of weak tidal interaction. Radio continuum emission is detected only from IRAS 04296+2923 and is confined to its nuclear region, consistent with previous studies. Modeling its multiband radio spectrum reveals a significant contribution from free–free emission at high frequencies (> 30 GHz) and a high FIR-to-radio flux ratio (q8.4 ≃ 3.2), implying a young, dust-obscured nuclear starburst. Taken together, the regular H I kinematics, the small velocity offset, and the group-scale environment favor an interpretation in which IRAS 04296+2923 and HI 0432+2926 form a gravitationally bound, orbiting galaxy pair embedded in a small group, rather than an advanced merger. In this context, the LIRG nature of IRAS 04296+2923 is more plausibly driven by internal processes, such as bar-induced gas inflow, possibly modulated by long-timescale, low-level tidal interactions with nearby group companions.
Key words: galaxies: interactions / galaxies: starburst / radio continuum: galaxies / radio lines: galaxies
© The Authors 2026
 Open Access article, published by EDP Sciences, under the terms of the Creative Commons Attribution License (https://creativecommons.org/licenses/by/4.0), which permits unrestricted use, distribution, and reproduction in any medium, provided the original work is properly cited.
This article is published in open access under the Subscribe to Open model. This email address is being protected from spambots. You need JavaScript enabled to view it. to support open access publication.
1. Introduction
The Infrared Astronomical Satellite (IRAS; Neugebauer et al. 1984) revealed a population of luminous and ultraluminous infrared galaxies (LIRGs and ULIRGs) with LIR = 1011 − 1012 L⊙ and > 1012 L⊙, respectively. These systems are predominantly major mergers or strongly interacting pairs, with more than 90% showing morphological or kinematic evidence of interaction (Haan et al. 2011). Galaxy mergers drive dramatic evolution by transporting large amounts of gas into the central kiloparsec through gravitational torques, thereby triggering intense starbursts and, in some cases, feeding active galactic nuclei (Sanders & Mirabel 1996; Hopkins et al. 2006). Enhanced star formation is observed in interacting pairs out to projected separations of ∼150 kpc (Scudder et al. 2012; Patton et al. 2013), in agreement with hydrodynamical simulations that predict tidal perturbations can induce central inflows long before final coalescence (Montuori et al. 2010).
Late-stage mergers typically exhibit strong tidal tails, bridges, and widespread star formation. However, an increasing number of LIRGs classified optically as isolated or “pre-merger” systems have been found, through H I imaging, to possess extended or asymmetric neutral gas reservoirs (Privon et al. 2015; Privon 2014). These observations indicate that intense nuclear star formation can be triggered well before the appearance of prominent large-scale tidal features. IRAS 04296+2923 is a nearby LIRG (LIR = 9.8 × 10¹⁰ L⊙; Meier et al. 2010) located at a distance of ∼29 Mpc behind the Taurus molecular cloud complex. Its nuclear starburst is extremely compact (confined within ∼150–250 pc) and has been interpreted as driven by a stellar bar (Meier et al. 2010, 2014; Davoust & Contini 2004). At the same time, Very Large Array (VLA) H I observations by Meier et al. (2009) hinted that IRAS 04296+2923 resides in a small group environment (Meier et al. 2009), raising the possibility that weak tidal interactions may also contribute to fueling its activity. This combination of a powerful but compact nuclear starburst and a potentially influential group environment makes IRAS 04296+2923 an ideal laboratory for investigating the onset of merger-induced star formation in the very earliest interaction phases.
In this paper we present H I 21-cm imaging from the archival VLA and Five-hundred-meter Aperture Spherical radio Telescope (FAST), combined with archival multifrequency radio continuum data, to characterize the neutral gas environment, kinematics, and star formation properties of IRAS 04296+2923 and its companions. Our main goals are (i) to map the distribution and kinematics of the neutral gas in the group, (ii) to search for early signatures of tidal interaction, and (iii) to examine the link between the extended gas reservoir and the compact nuclear starburst. The data collection, reduction, and analysis methods are described in Sect. 2. Results are presented in Sect. 3, discussed in Sect. 4, and summarized in Sect. 5. Throughout this work we adopt a flat Λ cold dark matter cosmology with H0 = 67.8 km s−1 Mpc−1, Ωm = 0.31, and ΩΛ = 0.69, and the radio spectral index convention Sν ∝ να.
2. Data collection, reduction, and analysis
2.1. The archival radio data
We collected archival radio data for this source, including both H I spectral-line and radio continuum observations. The H I data consist of two VLA projects: AM960 (PI: D. Meier) in the D configuration and AM985 (PI: D. Meier) in the C configuration (see Table 1). In addition, we make use of an H I image cube from the FAST All-Sky H I Survey (FASHI; PI: Ming Zhu). Details of the observations, data reduction, and cube construction are described in Zhang et al. (2024).
Parameters of H I line archive data of IRAS 04296+2923.
The radio continuum projects were mainly selected with a beam size larger than 1 arcsec (see Table 2), because the dominant radio continuum emission are believed to be compact at this scale Meier et al. (2010). The radio continuum flux densities at 150 MHz 200 MHz and 325 MHz were from Stein et al. (2021), which made the cross-identifications from three low-frequency radio surveys, including the TIFR GMRT Sky Survey (TGSS), the GaLactic and Extragalactic All-skyMWA (GLEAM) survey, the Westerbork Northern Sky Survey (WNSS), and the Arcminute Microkelvin Imager Galactic Plane Survey (AMIGPS) at 16 GHz (Perrott et al. 2015).
Multiband radio continuum emission of IRAS 04296+2923.
2.2. Radio data reduction
The data calibration of the VLA archive data was performed using the Common Astronomy Software Applications (CASA) package developed by the National Radio Astronomy Observatory (NRAO). The main processing steps included inspecting and flagging the bad data, amplitude calibration, bandpass calibration, phase calibration, and applying the calibration solutions to the target source. The “tfcrop” command was used to remove some radio frequency interference (RFI). For the spectral line data, we performed continuum subtraction in CASA software. The poor-quality channels at the beginning and end were deleted, and “intphase” and “scanphase” phase interpolations were also performed. The steps were referenced to the CASA User Manual for reducing VLA data. The calibrated data were imported into the Difmap package for making the radio continuum, H I channel images. All the images were made with natural weighting.
For the H I channel images from the VLA project, we also generated a primary beam image and performed primary beam correction and generated an image cube using CASA software. Then we also used CASA to produce moment 0, 1, and 2 images, which stands for images of total intensity, velocity centroid, and velocity dispersion, respectively. The moment maps set a threshold for regions with pixel values greater than 3σ. Meanwhile, we also used the SoFiA software (Serra et al. 2015; Westmeier et al. 2021) to analyze the H I image cube and generated similar moment maps. Following the official tutorial online1, the parameter settings were as follows: the spatial smoothing filter sizes (scfind.kernelsXY) were set based on the number of pixels per beam, kernelsXY = 0,4,8; and the spectral smoothing filter sizes (scfind.kernelsZ) were chosen according to the typical widths of the H I emission and absorption line profiles, kernelsZ = 3,7,15,31. Reliability checking was enabled. A scale factor for the size of the Gaussian kernel (reliability.scaleKernel) was set to 0.6, which was obtained by varying the the parameter and checking the diagnostic plots generated when the parameter reliability.plot = true, as is shown in the online tutorial. All other parameters remained at their default values. The source detection threshold (scfind.threshold) was set to 3.8, which lies within the recommended range of 3.5–4.5 and corresponds to approximately four times the noise level, typically yielding reliable results.
For each detected galaxy, the H I parameters (see Table 3), including the central velocity (VHI), the full width at half maximum (FWHM; W50), and the integrated flux density (S21), were measured from the total H I line profiles. The dynamical centers were determined using the SoFiA source-finding software. Optical counterparts were identified from the I-band Pan-STARRS image (Chambers et al. 2016). For IRAS 04296+2923 and HI 0432+2926, the line profiles cannot be well fit with Gaussian components; therefore, VHI was obtained from the intensity-weighted mean velocity and S21 from direct profile integration. Following Koribalski et al. (2004), the uncertainties were calculated as  , where S/N is the signal-to-noise ratio, W20 and W50 represent the velocity widths at 20% and 50% of the peak line intensity, respectively, and Δv is the velocity resolution. The uncertainty of W50 was estimated as σ(W50) = 2σ(VHI), and the uncertainty of the integrated flux density, S21, obtained by directly integrating over the H I line profile, is given by
  . For the other three sources, VHI, W50, S21, and their corresponding uncertainties were derived through Gaussian fitting in CASA.
Properties of the detected H I galaxies.
We also used the 3D-Based Analysis of Rotating Objects via Line Observations, also known as BBarolo (Di Teodoro & Fraternali 2015), to analyze the H I image cubes, including the construction of position–velocity (P–V) diagram images, and to perform tilted-ring modeling of the rotating disk of IRAS 04296+2923 and other detected H I galaxies. The software fits the observed H I cube directly in three dimensions in an automatic mode, minimizing the residuals between the data and the model, and allows us to recover the kinematic parameters such as rotation velocity, inclination, H I surface density, and systemic velocity.
2.3. Photometry of the Pan-STARRS images
For each H I detection, we retrieved the corresponding Pan-STARRS images to identify the optical counterparts and to perform basic photometric measurements. The photometric analysis and stellar mass estimates were carried out following the procedures described in Glowacki et al. (2024) and Reynolds et al. (2022). Source detection and masking of contaminating foreground and background objects were performed using the PHOTUTILS package. The photometry was conducted on the g- and r-band images, with segmentation maps generated via SEGMENTATION. Isophotes were fit using ISOPHOTE, and the total r-band flux was measured via aperture photometry within apertures defined by the reliable isophotes, yielding integrated magnitudes for each source. Assuming the Galactic dust extinction law described by Cardelli et al. (1989), the attenuation can be written as AV = RVE(B − V). The coefficients, RV, were taken to be 3.793 and 2.751 for the g and r bands, respectively (Wyder et al. 2007). The Galactic reddening, E(B − V), for each galaxy was obtained from the IRSA Dust Extinction Service2 at the sky position of each H I detection. This service provides two estimates of the dust extinction from Schlafly & Finkbeiner (2011) and Cardelli et al. (1989); in this work we adopt the values from Schlafly & Finkbeiner (2011). The g- and r-band magnitudes were then corrected for Galactic extinction using mcor = mobs − AV. The corrected magnitudes are listed in Table 3. The photometric analysis in this work is based on Python scripts and an accompanying cookbook publicly released by the WALLABY collaboration3.
Stellar masses were estimated using the empirical color–mass-to-light relation from Taylor et al. (2011):
where the coefficients −0.840 and 1.654 are empirically calibrated constants (Zibetti et al. 2009). The g − r color and the apparent magnitude, m, are measured in the SDSS photometric system, Dmod, is the distance modulus, h is the Hubble constant in units of 100 km s−1 Mpc−1, and M⊙, r = 4.64 is the absolute magnitude of the Sun in the r band (Willmer 2018). The typical uncertainty in the derived stellar masses is ∼0.16 dex, dominated by uncertainties in the photometry and the empirical mass-to-light relation (see Glowacki et al. 2024; Reynolds et al. 2022, for details).
3. Results
3.1. Detection of H I emission in IRAS 04296+2923 and its companion galaxies
Using both VLA-D and VLA-C array data, we imaged the H I emission in IRAS 04296+2923 within a region of approximately 30 arcminutes, corresponding to the VLA primary beam at 1.4 GHz. We also analyzed the H I image cube of the same source from the FASHI project, which covers a comparable field of view. The integrated total intensity (moment-0) maps of the detected H I emission are presented in Figs. 1 and A.1. From these maps, we identified five H I galaxies, including IRAS 04296+2923 and its companion HI 0432+2926, separated by about 4.7 arcmin, as well as three additional galaxies located roughly 17–22 arcmin from IRAS 04296+2923. The basic image parameters of these galaxies are listed in Table 3.
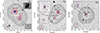 |
Fig. 1. H I emission contours overlaid on Pan-STARRS optical images of IRAS 04296+2923 and its galaxy group members. Red, blue, and black contours represent the combined H I total intensity (moment 0) maps from the VLA D-array, VLA C-array, and FAST observations, respectively. White contours in the upper left panel indicate central H I absorption toward IRAS 04296+2923 as detected in the VLA C-array data. For the left panel, the contour levels are: red: 0.03, 0.06, 0.12, 0.24, 0.48, 0.96, 1.30, and 1.54 Jy beam−1 km s−1; blue: 0.09, 0.18, and 0.36 Jy beam−1 km s−1; black: 0.10, 0.20, 0.40, 0.80, 1.60, and 3.20 Jy beam−1 km s−1; white (absorption): −0.30, −0.40, −0.50, and −0.60 Jy beam−1 km s−1. For the remaining panels, the contour levels are: red: 0.40, 0.80, and 1.60 Jy beam−1 km s−1; blue: 0.18, 0.36, and 0.72 Jy beam−1 km s−1; black: 0.10, 0.20, 0.40, 0.80, 1.60, and 3.20 Jy beam−1 km s−1. In all panels, the lowest contour corresponds to the 3σ level. White and red crosses mark the optical and H I centroid positions of the detected sources listed in Table 3. Insets show zoomed-in optical views of the individual galaxies. The lower left inset indicates the synthesized beam sizes for each dataset (see Table 1 for beam parameters). |
The 3σ contour image from the VLA-D data shows that the H I emission of IRAS 04296+2923 extends over a box-shaped region of approximately 3.5 × 3 arcmin, which is about 26 times larger than the synthesized beam. This extent is also larger than that seen in the near-infrared J-band image (Fig. 1), where the ring-like spiral arms appear weak and span about 2.5 × 1.6 arcmin. The 3σ H I contour image from the FAST data shows that the H I emission is distributed over a much larger area (about 5.6 × 5.6 arcmin), encompassing both IRAS 04296+2923 and HI 0432+2926.
The extracted H I spectra of these five galaxies are shown in Figs. 2 and A.2, and their fit line parameters are summarized in Table 3. The H I spectrum of IRAS 04296+2923 from the VLA-C data is about half the flux of that from the other projects, suggesting that part of the extended H I emission may have been resolved out by the higher-resolution C-array. The H I fluxes derived from the other projects are consistent with each other. Of the five galaxies, IRAS 04296+2923 has the highest H I mass and the broadest linewidth. In addition, the VLA-C data reveal H I absorption in the central region of IRAS 04296+2923 (see Fig. 1). The absorption profiles are broad and cover the same velocity range as the H I emission lines (see Fig. 2), indicating the presence of a dense column of cold atomic gas in front of the nucleus.
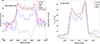 |
Fig. 2. H I line profiles from VLA-C, VLA-D, and FAST observations of IRAS 04296+2923 (left) and HI 0432+2926 (right). For IRAS 04296+2923, the H I emission lines were extracted from a circular region with a diameter of 3.4′, centered at RA = 04h32m48.9s, Dec = +29° 29′53.1″. The H I absorption spectrum was obtained from a box region centered at RA = 04h32m48.6s, Dec = +29° 29′57.4″, with a size of about 20″ × 20″. The black line represents the Nançay H I data from Chamaraux et al. (1995). For HI 0432+2926, the H I emission lines were extracted from a box region centered at RA = 04h32m33.7s, Dec = +29° 26′26.5″, with a size of about 2.5′ × 4.1′. Because the angular resolution of the FAST telescope is relatively low, the two galaxies cannot be fully separated in the FAST H I image. Therefore, the FAST H I line profiles were extracted from two box regions, as indicated in Fig. A.1. In the left panel, the y axis of the H I absorption line is shown on the right, while those of the emission lines are on the left. |
The H I line profiles of IRAS 04296+2923 and HI 0432+2926 display double peaks, corresponding to the receding and approaching sides of rotating disks. In contrast, the other three galaxies show single-peaked profiles with FWHM values ranging from 50 to 90 km s−1 (see Table 3). The systemic velocities of IRAS 04296+2923 and HI 0432+2926 are similar, with the latter being about 20–30 km s−1 higher. HI 0433+2909 has the highest systemic velocity, about 2200 km s−1, while HI 0432+2944 and HI 0431+2947 have comparable velocities of approximately 1984 and 1973 km s−1, respectively.
3.2. Velocity structure analysis of IRAS 04296+2923 and HI 0432+2926
We found that IRAS 04296+2923 and HI 0432+2926 are separated by about 40 kpc. Both galaxies exhibit strong H I emission, and their H I line profiles display double peaks corresponding to the receding and approaching sides of rotating disks. Figure 3 shows the velocity maps generated using CASA from the VLA-C and VLA-D array data. The PV diagrams of the two galaxies are presented in Figs. 4 and A.3, respectively. These maps clearly reveal ordered velocity fields consistent with disk rotation in both systems.
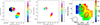 |
Fig. 3. Velocity (moment 1) maps of IRAS 04296+2923 and HI 0432+2926. Left and middle: Velocity fields derived from the VLA-D and VLA-C array data, respectively. Right: Velocity map from the FAST H I survey data, with red contours representing the H I emission from the VLA-D project, as shown in Fig. 1. The synthesized beam of each observation is shown in the lower left corner of each panel. |
The velocity map derived from the FAST H I cube exhibits a velocity gradient of about 200 km s−1, running from the southeast to the northwest across both galaxies (see Fig. 3). This is consistent with the VLA-C and VLA-D velocity maps, which show that the western side of IRAS 04296+2923 and the northern side of HI 0432+2926 have the highest line-of-sight velocities. The velocity dispersion map (Fig. A.4) indicates a slightly enhanced velocity dispersion in the central region of IRAS 04296+2923, which may be caused by gas turbulence or overlapping motions associated with the stellar bar. This is consistent with the broad H I absorption features seen in the central region from the VLA-C data (Fig. 2).
The moment maps generated using SoFiA for the H I data are presented in Figs. 5 and A.5. These maps incorporate both spatial and velocity smoothing procedures. The identified H I emission region (approximately 4 × 5 arcmin) is comparable to, but slightly larger than, the 3σ H I contour region (about 3.5 × 3 arcmin) shown in Fig. 1. The SoFiA-derived H I emission extends toward the northern part of the system and possibly forms a connecting bridge between the two galaxies. Since the H I emission region identified by SoFiA – due to its smoothing in both spatial and velocity dimensions – differs slightly from the conventional 3σ H I region defined per pixel, we further extracted H I line profiles from several specific regions as shown in Fig. A.6. The corresponding spectra are displayed in Fig. A.7. Regions 1–9 correspond to IRAS 04296+2923, while Regions 10 and 11 were selected from the SoFiA moment map. Region 10 lies between IRAS 04296+2923 and HI 0432+2926, representing the bridge region that shows weak, redshifted H I emission. Region 11 corresponds to the extended northern region, which exhibits the most redshifted velocities in the velocity map. The fit parameters of these H I line profiles are summarized in Table A.1.
The extracted spectra are consistent with the velocity map: the eastern regions (1, 4, and 7) show the lowest velocities (∼2030 km s−1), the western regions (3, 6, and 9) exhibit the highest velocities (∼2220 km s−1), and the central regions (2, 5, and 8) have intermediate velocities (∼2120 km s−1) (see Fig. A.7 and Table A.1). Both regions 10 and 11, identified in the SoFiA map, show weak H I emission. The spectrum of region 10 in the VLA-D data displays a weak, redshifted line with a central velocity of ∼2450 km s−1, whereas region 11 shows a broad, weak H I profile ranging from 1800–2500 km s−1, which may indicate turbulent gas motions in this area.
3.3. The multiband radio continuum emission of IRAS 04296+2923
Meier et al. (2010) suggested that the starburst activity in IRAS 04296+2923 is confined within a compact region of 1″–2″ (150–250 pc) around the nucleus, based on the spatial extent of its radio continuum emission. Radio images with spatial resolutions comparable to that of the VLA A-configuration at L band (∼2″) therefore provide a reliable measure of the total radio emission from the system.
We present the radio continuum maps extracted from the line-free channels of the VLA C-configuration data. To complement these data, we also compiled archival observations with synthesized beams larger than 2″ (see Table 2) and generated the corresponding continuum images shown in Fig. A.8. From these images, we measured both the integrated and peak flux densities for each dataset. The resulting spectral index (α ∼ −0.87; Fig. 6) is consistent with values commonly found in LIRGs, indicative of nonthermal synchrotron emission associated with intense star formation (e.g., Leroy et al. 2011).
4. Discussion
4.1. Properties of the IRAS 04296 galaxy group
Meier et al. (2009) suggested that IRAS 04296+2923 may reside in a small galaxy group. To examine this possibility, we searched for nearby galaxies using H I images from multiple VLA projects and the FAST survey. Five H I-detected galaxies are identified as likely members of the same system.
4.1.1. Characterizing the galaxies in this group
We identified optical counterparts for all five galaxies in the IRAS 04296+2923 group. Among them, IRAS 04296+2923 has the highest H I mass as well as the highest stellar mass (see Table 3). In contrast, HI 0432+2926 possesses a relatively high H I mass but the lowest stellar mass in the group, and correspondingly exhibits the faintest apparent magnitudes in both the g and r bands. For most group members, the derived H I and stellar masses broadly follow the empirical MH I−M* relation reported in the literature (e.g., Glowacki et al. 2024; Maddox et al. 2015). A notable exception is HI 0432+2926, which deviates significantly from this relation. Based on its H I mass and extinction-corrected optical luminosity inferred from the g- and r-band magnitudes, we estimate an unusually high H I mass-to-light ratio of MH I/LB ∼ 9. Such an extreme value places HI 0432+2926 within the class of so-called “almost dark” galaxies, which are characterized by inefficient or suppressed star formation (Cannon et al. 2015). The spatial coincidence between the H I emission and the faint optical counterpart indicates that HI 0432+2926 is not a truly “dark” galaxy, in which neutral gas fails to reach the critical surface density required to initiate star formation (Šiljeg et al. 2026). Nevertheless, deeper optical spectroscopy observations will be required to further constrain the nature of its stellar component and star formation activity.
All five galaxies lie at similar Galactic latitudes (b ≃ −12°) and have systemic velocities of ∼2000 km s−1 derived from their H I profiles, making this system well suited for a comparison with nearby galaxy groups in the Local Supercluster. Makarov & Karachentsev (2009) showed that well-populated groups with more than four members are typically characterized by a velocity dispersion of ∼74 km s−1 and a harmonic radius of ∼204 kpc. Comparable values have also been reported for galaxy groups and clouds in the local Universe (z ∼ 0.01) by Makarov & Karachentsev (2011). Using the systemic velocities listed in Table 3, we estimate a velocity dispersion of ∼100 km s−1 for the IRAS 04296+2923 group. The corresponding harmonic radius is ∼214 kpc. Both values are consistent with those of typical nearby galaxy groups reported in the literature (e.g., Makarov & Karachentsev 2009; Karachentsev 2005).
4.1.2. H I view of the large-scale environment
The projected extent of the group is approximately 50 arcmin (corresponding to ∼435 kpc; see Fig. A.1), fully covered within the VLA field of view. Although the FAST H I data span a much larger area (∼200 arcmin across), no additional H I sources are detected near the group. The nearest other H I galaxy HI 0430+2846, located at (RA = 04:30:10.5, Dec = 28:46:29.1), with a system velocity of Vc = 2086 ± 19 km s−1 (see Fig. A.2), lies 106 arcmin away (∼922 kpc from IRAS 04296+2923). Given this large separation, it is unlikely to be a bound member of the group.
As is shown in Fig. A.1 and Table 3, the two northwestern members (HI 0431+2947 and HI 0432+2944) have the lowest systemic velocities (∼1970–1990 km s−1), while the southeastern galaxy (HI 0433+2909) exhibits the highest value (∼2210 km s−1). The two central galaxies (IRAS 04296+2923 and HI 0432+2926) lie between these extremes and possess the highest H I masses. This spatial–kinematic distribution suggests that the central pair may constitute the gravitational core of the group, with the three outer galaxies orbiting around them. Assuming a simple virial relation, M = RV2/G, where R is the projected separation and V is the corresponding velocity offset, we estimated the total mass of the central pair using the positions and velocities of the three outer members (Table 3). The inferred masses are 2.7 × 10¹¹ M⊙ (from HI 0433+2909), 7 × 10¹¹ M⊙ (from HI 0432+2944), and 1 × 10¹² M⊙ (from HI 0431+2947). Because the orbital inclinations of these satellites are unknown, these estimates represent lower limits, implying a group mass exceeding 1 × 10¹² M⊙. This is roughly 300 times the combined H I mass of the two central galaxies (3.6 × 10⁹ M⊙; Table 3).
Using the rotation curves fit with 3D-Barolo (Fig. A.9), we obtained dynamical masses of 8 × 10¹⁰ M⊙ within 18 kpc for IRAS 04296+2923 and 2.9 × 10¹⁰ M⊙ within 14 kpc for HI 0432+2926, yielding a combined mass of ∼1.1 × 10¹¹ M⊙. This accounts for only ∼11% of the total mass derived from the outer members, implying that at least 89% of the mass in this system must be in the form of an extended dark matter halo far beyond the observed H I disks. This is broadly consistent with the commonly accepted picture that dark matter contributes 80–90% of the total mass in galaxies and dominates at large radii beyond the stellar and gaseous components (Harris et al. 2020; van Albada & Sancisi 1986; Wechsler & Tinker 2018). Nevertheless, the possibility of there being undetected massive group members that are not visible in H I cannot be ruled out.
4.2. H I kinematic structure and modeling
The H I velocity structure of IRAS 04296+2923 and its companion H I 0432+2926 was investigated using VLA D- and C-array observations, supplemented by the FAST H I survey (see Sect. 3.2). To quantify the gas dynamics, we further modeled the three-dimensional H I data cubes with 3D-BAROLO (Fig. A.10). For both galaxies, the models reproduce the main kinematic structures, as is reflected by the small residuals in intensity and velocity. In IRAS 04296+2923, the residual maps show localized deviations that may arise from noncircular motions, turbulent gas, or beam-smearing effects. The intensity residuals reveal a systematic north–south asymmetry, with enhanced H I emission on the northern side of the disk. Given that the H I 21 cm line is optically thin, this asymmetry does not reflect radiative transfer or obscuration effects, but instead indicates a genuine asymmetry in the H I column density distribution. The northern side of the galaxy corresponds to the near side of the disk (Meier et al. 2010), and the observed enhancement is plausibly associated with bar-driven gas dynamics. In particular, gas compression along the downstream sides of bar-induced streaming flows can locally increase the H I surface density, while the opposite side may be characterized by more diffuse gas or mild kinematic dilution in the upstream regions. In contrast, H I 0432+2926 shows a more symmetric gas distribution and regular velocity field, with low velocity dispersions (σ ≲ 30 km s−1) and weak residuals, consistent with a dynamically settled rotating disk.
The fit rotation curves and systemic velocities are shown in Fig. A.9. For IRAS 04296+2923, the rotation curve flattens at Vrot ∼ 180 − 200 km s−1 beyond ∼20″, consistent with a massive, rotation-supported disk. The residual velocity field shows small-scale asymmetries suggestive of mild noncircular motions related to gravitational interaction. In contrast, H I 0432+2926 shows a gradually rising rotation curve that levels off at Vrot ∼ 70 − 100 km s−1, typical of a lower-mass, less evolved system. The systemic velocities remain stable across rings in both galaxies, confirming well-constrained kinematic centers. The CO(1–0) PV diagram of Meier et al. (2010), their Fig. 9) shows a nearly solid-body rise in the inner 15″, reaching ≳100 km s−1 within 5–10″. This steep gradient, well reproduced by their bar model, indicates strong bar-driven noncircular motions in the molecular gas. Position–velocity (PV) slices extracted along the kinematic major and minor axes using 3D-BAROLO are shown in Fig. 4 for IRAS 04296+2923 and Fig. A.3 for H I 0432+2926. The H I PV slices of IRAS 04296+2923 show a shallower velocity gradient and only mild S-shaped distortions within ±20 − 30″, consistent with beam smearing and the intrinsic absence of strong noncircular motions in the atomic gas. By contrast, H I 0432+2926 shows a narrow velocity width and no clear noncircular signatures, emphasizing its dynamically regular nature. Together, these differences highlight that IRAS 04296+2923 is currently experiencing the earliest kinematic effects of tidal interaction within the system. A comparison of the HI and CO PV diagrams further reveals that the HI disk extends to offsets of ∼150″, whereas the CO emission is confined to the central ∼20″. This indicates that a compact molecular core is embedded within a much more extended atomic disk. The H I kinematics, together with the steep central CO gradient, are consistent with bar-driven inflows that may be feeding nuclear star formation.
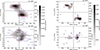 |
Fig. 4. PV diagrams of IRAS 04296+2923 from VLA-D (left) and VLA-C (right) observations. The diagrams are generated from the H I data cubes using the 3D-BAROLO fitting software. The blue contours show the observed data, while the red contours indicate the best-fit model results. The yellow dots mark the fit rotation curve derived from the model. The angles (ϕ) in the upper right corners denote the position angles obtained from the kinematic fitting. The gray contour at the center of the right panels highlights the region where strong H I absorption is detected in the C-configuration data. |
Large-scale, diffuse H I emission is detected in both galaxies, especially in the FAST and VLA-D data (see Figs. 1, 3, and A.1). The H I disks extend several times beyond the optical extents, indicating that both systems are extremely gas-rich. The diffuse H I emission in regions 10 and 11 (Figs. 5 and A.7) may trace gas stirred by the ongoing tidal interaction. The FAST image further suggests that the westernmost H I of IRAS 04296+2923 and the northernmost H I of H I 0432+2926 may already be in contact. Although this region is not detected in the VLA-D map, deeper observations are required to confirm the physical connection. Overall, the combination of high-resolution VLA imaging and wide-field FAST mapping shows that IRAS 04296+2923 is a massive, rotation-supported disk undergoing mild dynamical disturbance, while H I 0432+2926 is less massive and more kinematically regular.
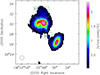 |
Fig. 5. Integrated intensity (moment 0) map of IRAS 04296+2923 (upper left) and HI 0432+2926 (lower right). The maps are derived from the VLA–D array H I data using SOFIA. The white contours show the 3σ H I emission from the same VLA–D data, identical to those displayed in Fig. 1. Region 11 (green box) covers an area of 3′ × 2′, while region 10 (green circle) covers 100″ × 100″. The corresponding H I spectral profiles extracted from these regions are presented in Fig. A.7, and the fit parameters are summarized in Table A.1. |
4.3. Comparsion with other LIRGs at similar merging stages
4.3.1. comparsion with ngc 253
Meier et al. (2014) investigated the properties of dense molecular gas in the inner disk and found a strong morphological similarity between NGC 253 and IRAS 04296+2923. Both are strongly barred spiral galaxies hosting nuclear starbursts that are likely triggered by bar-driven gas inflows. The gas properties in IRAS 04296+2923 are comparable to those in the well-studied starburst galaxy NGC 253.
Lucero et al. (2015) presented H I observations of NGC 253 obtained with the SKA precursor KAT-7. We also compared the H I properties of IRAS 04296+2923 and NGC 253. The total H I mass derived from the VLA-D data for IRAS 04296+2923 is about 2.3 × 10⁹ M⊙ (see Table 3), which is similar to that of NGC 253 (∼2.1 × 10⁹ M⊙; see Lucero et al. 2015). Using the inclination-corrected H I surface densities from the 3D-BAROLO modeling, the radial profile of IRAS 04296+2923 (see Fig. 7) shows a clear mid-disk peak similar to that observed in the starburst galaxy NGC 253. Such a feature is typical of massive, actively star-forming spiral disks and is consistent with the H I distributions reported for normal spirals (e.g., Martinsson et al. 2016). In contrast, H I 0432+2926 displays a smoothly declining H I profile without a mid-disk enhancement, a form characteristic of low-mass late-type galaxies that generally lack the ring-like H I structure seen in more massive systems (Swaters et al. 2002). This contrast suggests different gas distributions and possibly different evolutionary or mass regimes between the two galaxies.
Boomsma et al. (2005) reported that the H I disk of NGC 253 is relatively compact compared to its deep optical extent. In contrast, IRAS 04296+2923 exhibits a comparable H I size but a more extended disk relative to its optical radius. This suggests that IRAS 04296+2923 retains a larger neutral gas reservoir in its outer disk. Combined with the unusual CO isotopic ratios and other molecular gas diagnostics in the inner disk (Meier et al. 2014), these similarities in H I structure and total gas content support the interpretation that IRAS 04296+2923 and NGC 253 represent highly similar systems, with the starburst in IRAS 04296+2923 occurring at an earlier evolutionary phase, before significant gas depletion or feedback has altered the disk properties as extensively as in NGC 253.
4.3.2. Comparison of HI line profile concentration with M1 and M2 merger-stage LIRGs
Fernandez et al. (2010) showed that a large fraction of IRAS galaxies exhibit distorted H I spectral features, suggesting that many of them are interacting or merging systems. Yu et al. (2020) defined the concentration parameter of the H I line profile as CV = V85/V25, where V85 and V25 represent the velocity widths enclosing 85% and 25% of the total integrated flux, respectively. Zuo et al. (2022) further demonstrated that this parameter effectively distinguishes mergers from non-mergers based on their H I line profiles, whereas neither the line width nor the asymmetry parameters alone provide clear merger diagnostics.
Following the method of Zuo et al. (2022), we calculated the CV values for the M1 and M2 merger-stage samples defined in Larson et al. (2016). As is shown in Fig. A.11, the CV values of sources in the M1 merging phase are significantly smaller than those in the M2 phase. The mean CV is 3.98 for M1 systems and 5.35 for M2 systems, indicating that the H I line profiles of M2 galaxies are more concentrated (tending toward a single-peaked shape) compared to those in the M1 phase.
For comparison, the CV values of IRAS 04296+2923 and H I 0432+2926 are 2.88 and 3.35, respectively. These values are even smaller than those typically found in M1 systems and are instead comparable to the CV values of non-merging galaxies reported by Zuo et al. (2022). This suggests that the interaction between IRAS 04296+2923 and H I 0432+2926 has not significantly affected the H I kinematics or overall line profiles of the two galaxies. This interpretation is consistent with our VLA imaging results presented in Sect. 4.2, which show no strong morphological or kinematic disturbances in their H I distributions.
4.4. Implications for star formation activity in IRAS 04296+2923
Multiband radio continuum observations detect emission only from IRAS 04296+2923, while HI 0432+2926 and other nearby group members remain undetected (see Figs. A.8 and A.12). The radio continuum spectrum of IRAS 04296+2923 (Fig. 6) is well described by a steep nonthermal synchrotron component (α ≈ −0.87) plus a thermal free–free contribution that becomes increasingly important above ∼30 GHz. The SED fitting follows the model
![Mathematical equation: $$ \begin{aligned} S_\nu = \left( 1 - e^{-\tau (\nu )} \right) \Bigg [ B + A \left( \frac{\nu }{\nu _t} \right)^{0.1 + \alpha } \Bigg ] \left( \frac{\nu }{\nu _t} \right)^2, \end{aligned} $$](/articles/aa/full_html/2026/05/aa58393-25/aa58393-25-eq4.gif) (1)
(1)
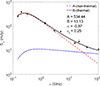 |
Fig. 6. Multiband integrated flux densities of IRAS 04296+2923. The values are listed in Table 2. The solid line represents the best-fitting model described by Eq. (1). The dashed and dash-dotted lines indicate the thermal (free-free) and nonthermal (synchrotron) components, respectively. |
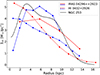 |
Fig. 7. Radial H I surface density profiles of IRAS 04296+2923 and H I 0432+2926. For each galaxy, the profiles derived from the VLA–D and VLA–C configurations are shown in red and blue, respectively, with solid lines representing IRAS 04296+2923 and dashed lines representing H I 0432+2926. For comparison, the H I radial profile of NGC 253 from the KAT-7 observations (Lucero et al. 2015) is plotted as the solid black line. |
where A and B are the synchrotron and free–free normalization constants, and the optical depth is parameterized as τ(ν) =(ν/νt)−2.1 (Galvin et al. 2018). The derived turnover frequency, νt ≈ 0.25 GHz, indicates strong free–free absorption in dense ionized gas, consistent with a compact, obscured nuclear starburst.
The radio SED of IRAS 04296+2923 is notably similar to that of the central starburst region in NGC 253 (Kapińska et al. 2017), which also shows a turnover near 0.23 GHz. The physical scales of the central starburst regions in both galaxies are likewise comparable, each confined within ≲500 pc (Kapińska et al. 2017; Meier et al. 2010). However, after accounting for distance, the 1.4 GHz radio luminosity of IRAS 04296+2923 is approximately five times higher than that of the NGC 253 nuclear starburst (based on 140 mJy and 2 Jy flux densities, respectively; Kapińska et al. 2017). IRAS 04296+2923 also exhibits a higher IR luminosity (log LIR ≈ 10.97 L⊙, Sanders et al. 2003) compared to NGC 253 (log LIR ≈ 10.44 L⊙, Sanders et al. 2003). The elevated radio and IR luminosities of IRAS 04296+2923 may reflect a more gas-rich central environment, even though several physical conditions of their nuclear regions appear broadly similar (see Meier et al. 2014).
Bressan et al. (2002) and Clemens et al. (2008) showed that very young starbursts often display an excess of FIR emission relative to radio emission, because thermal free–free processes dominate before the onset of strong supernova-driven synchrotron radiation. To examine this effect, we computed the FIR–radio flux ratio (Helou et al. 1985):
 (2)
(2)
where Sν is the radio flux density and the FIR flux was estimated as
 (3)
(3)
IRAS 04296+2923 has IRAS flux densities of 42.13 Jy at 60 μm and 48.27 Jy at 100 μm (Sanders et al. 2003). Using the 8.4 GHz flux density extracted from the SED (34.92 mJy), we obtained q8.4 = 3.2. This value is significantly higher than the mean q8.4 found for (U)LIRGs (e.g., Clemens et al. 2008; Baan & Klöckner 2006), indicating that the radio emission is relatively weak for its FIR luminosity. Such a high q implies a substantial thermal fraction and is likely consistent with IRAS 04296+2923 hosting a young nuclear starburst.
Neutral hydrogen (H I) is a sensitive tracer of galaxy–galaxy interactions. Disturbed H I morphologies, as well as asymmetric or broadened line profiles, are commonly associated with tidal interactions or external gas accretion (Yun et al. 1994; Koribalski & Manthey 2005), whereas an ordered H I velocity field accompanied by symmetric double-horn profiles typically indicates a dynamically settled rotating disk. The galaxy pair IRAS 04296+2923 and HI 0432+2926 exhibits a small line-of-sight velocity difference of Δv = 26 km s−1 and a projected separation of 40 kpc. Dynamical masses derived from 3D-Barolo rotation curve fits are 8 × 10¹⁰ M⊙ within 18 kpc for IRAS 04296+2923 and 2.9 × 10¹⁰ M⊙ within 14 kpc for HI 0432+2926 (see Sect. 4.1.2). The low relative velocity, when considered together with the inferred dynamical masses and separation, is consistent with the system being gravitationally bound. Within the interaction-stage classification framework of Larson et al. (2016), the combination of projected separation and velocity offset places this system in a regime broadly consistent with an early interaction stage (M1), corresponding to the initial approach prior to the first pericentric passage. However, high-resolution infrared, optical, and radio imaging (Meier et al. 2010, 2014), together with the H I data presented in this work, reveal no evidence of prominent tidal tails, significant velocity-field distortions, or other morphological signatures indicative of a strong interaction. The rotation curves of both galaxies remain regular and well fit, consistent with largely undisturbed disk kinematics. Taken together, these kinematic and morphological properties favor the interpretation that IRAS 04296+2923 and HI 0432+2926 constitute a bound, orbiting galaxy pair rather than an actively merging system. A rough, order-of-magnitude estimate of the orbital timescale, based on Kepler’s third law and assuming a bound two-body configuration, yields a timescale of ∼1–2 Gyr, implying that tidal perturbations are currently weak. The LIRG nature of IRAS 04296+2923, with its elevated star formation rate, is therefore more plausibly driven by internal processes, such as bar-induced gas inflow (e.g., Meier et al. 2010), possibly modulated by long-timescale, low-level tidal forcing from the companion, rather than by an advanced merger phase, a scenario commonly observed in nearby galaxy groups (Conselice 2007).
While a very early pre-merger configuration cannot be entirely excluded, the observed properties impose significant constraints on such a scenario. At the current projected separation of 40 kpc, the combination of the inferred galaxy masses and the small line-of-sight velocity difference (Δv = 26 km s−1) would require either a nearly face-on orbital geometry, in which the orbital plane lies close to the plane of the sky, or a highly eccentric orbit in which the galaxies spend most of their time near apocenter, where relative velocities are naturally low. In the former case, projection effects can significantly reduce the apparent surface-brightness contrast and morphological distinctiveness of tidal features, making them more difficult to detect observationally (e.g., Duc & Renaud 2013). In the latter case, strong tidal perturbations would occur only briefly during pericentric passage, further limiting the visibility of tidal signatures at most orbital phases. An additional important constraint arises from the group environment: IRAS 04296+2923 and HI 0432+2926 reside in a small galaxy group that includes at least three lower-mass members, as is revealed by our H I observations. The presence of multiple apparently stable satellite galaxies suggests a dynamically mature, low-velocity-dispersion group potential, in which long-lived bound orbits are common and merger timescales are substantially prolonged. Nevertheless, given the absence of detectable tidal disturbances in both the H I morphology and kinematics presented in this work, together with the group-scale dynamical context, we favor an interpretation in which IRAS 04296+2923 and HI 0432+2926 form a long-period, weakly interacting bound pair.
5. Summary
We have analyzed archival VLA and FAST H I 21 cm data, together with archival multiband radio continuum observations, to investigate the neutral gas distribution and star-forming activity in the nearby LIRG IRAS 04296+2923. The H I maps reveal that IRAS 04296+2923 and its companion H I 0432+2926 are members of a small group of five galaxies. The two main galaxies have comparable total H I masses and a projected separation of ∼40 kpc. Both systems exhibit regular velocity fields and symmetric double-horn line profiles, typical of rotation-dominated disks. Apart from minor outer-disk asymmetries, the H I morphology and kinematics show no convincing evidence of significant tidal disturbance, suggesting that the system remains dynamically regular.
Radio continuum emission is detected only from IRAS 04296+2923 and is confined to the nuclear region. The compact morphology and spatial extent of the emission are consistent with the 150–250 pc starburst region reported by Meier et al. (2010) and Meier et al. (2014), and our analysis supports their interpretation of a compact, centrally concentrated starburst. The broadband radio spectrum exhibits a significant free–free contribution at high frequencies and a high FIR-to-radio ratio (q8.4 ∼ 3.2), both of which are indicative of a young, dust-enshrouded nuclear starburst.
The coexistence of a dynamically regular large-scale H I disk and a compact nuclear starburst, together with the presence of a stellar bar, strongly suggests that bar-driven inflow is the dominant mechanism funneling gas into the nucleus and triggering the current episode of star formation. Although the nearby gas-rich companion may exert a weak tidal influence, the absence of prominent large-scale tidal features or kinematic distortions implies that external interaction plays only a minor role at this stage. Based on the regular H I morphology and kinematics, we conclude that IRAS 04296+2923 and HI 0432+2926 are best described as a long-period, weakly interacting bound pair. The embedding of this pair in a small galaxy group with additional low-mass members provides a natural dynamical context for such a configuration.
Acknowledgments
We thank the anonymous referee for his/her useful comments and suggestions on the manuscript. This work is supported by the grants of NSFC (Grant No. 12363001) and Guizhou Provincial Major Scientific and Technological Program XKBF (Grant No. (2025)010 and (2025)011). This work makes use of archival data from the Very Large Array (VLA) and the the FAST All Sky HI survey (FASHI) project. The National Radio Astronomy Observatory is a facility of the National Science Foundation operated under cooperative agreement by Associated Universities, Inc. FAST is a Chinese national mega-science facility, operated by the National Astronomical Observatories of Chinese Academy of Sciences (NAOC).
References
- Baan, W. A., & Klöckner, H.-R. 2006, A&A, 449, 559 [NASA ADS] [CrossRef] [EDP Sciences] [Google Scholar]
- Boomsma, R., Oosterloo, T. A., Fraternali, F., van der Hulst, J. M., & Sancisi, R. 2005, A&A, 431, 65 [NASA ADS] [CrossRef] [EDP Sciences] [Google Scholar]
- Bressan, A., Silva, L., & Granato, G. L. 2002, A&A, 392, 377 [NASA ADS] [CrossRef] [EDP Sciences] [Google Scholar]
- Cannon, J. M., Martinkus, C. P., Leisman, L., et al. 2015, AJ, 149, 72 [NASA ADS] [CrossRef] [Google Scholar]
- Cardelli, J. A., Clayton, G. C., & Mathis, J. S. 1989, ApJ, 345, 245 [Google Scholar]
- Chamaraux, P., Kazes, I., Saito, M., Yamada, T., & Takata, T. 1995, A&A, 299, 347 [Google Scholar]
- Chambers, K. C., Magnier, E. A., Metcalfe, N., et al. 2016, arXiv e-prints [arXiv:1612.05560] [Google Scholar]
- Clemens, M. S., Vega, O., Bressan, A., et al. 2008, A&A, 477, 95 [NASA ADS] [CrossRef] [EDP Sciences] [Google Scholar]
- Conselice, C. J. 2007, in Groups of Galaxies in the Nearby Universe, eds. I. Saviane, V. D. Ivanov, & J. Borissova, 123 [Google Scholar]
- Davoust, E., & Contini, T. 2004, A&A, 416, 515 [NASA ADS] [CrossRef] [EDP Sciences] [Google Scholar]
- Di Teodoro, E. M., & Fraternali, F. 2015, MNRAS, 451, 3021 [Google Scholar]
- Duc, P.-A., & Renaud, F. 2013, Lect. Notes Phys., 861, 327 [NASA ADS] [CrossRef] [Google Scholar]
- Fernandez, M. X., Momjian, E., Salter, C. J., & Ghosh, T. 2010, AJ, 139, 2066 [Google Scholar]
- Galvin, T. J., Seymour, N., Marvil, J., et al. 2018, MNRAS, 474, 779 [Google Scholar]
- Glowacki, M., Albrow, L., Reynolds, T., et al. 2024, MNRAS, 529, 3469 [Google Scholar]
- Haan, S., Surace, J. A., Armus, L., et al. 2011, AJ, 141, 100 [Google Scholar]
- Harris, W. E., Remus, R.-S., Harris, G. L. H., & Babyk, I. V. 2020, ApJ, 905, 28 [CrossRef] [Google Scholar]
- Haynes, M. P., Giovanelli, R., Kent, B. R., et al. 2018, ApJ, 861, 49 [Google Scholar]
- Helou, G., Soifer, B. T., & Rowan-Robinson, M. 1985, ApJ, 298, L7 [Google Scholar]
- Hopkins, P. F., Hernquist, L., Cox, T. J., et al. 2006, ApJS, 163, 1 [Google Scholar]
- Kapińska, A. D., Staveley-Smith, L., Crocker, R., et al. 2017, ApJ, 838, 68 [CrossRef] [Google Scholar]
- Karachentsev, I. D. 2005, AJ, 129, 178 [NASA ADS] [CrossRef] [Google Scholar]
- Koribalski, B., & Manthey, E. 2005, MNRAS, 358, 202 [Google Scholar]
- Koribalski, B. S., Staveley-Smith, L., Kilborn, V. A., et al. 2004, AJ, 128, 16 [Google Scholar]
- Larson, K. L., Sanders, D. B., Barnes, J. E., et al. 2016, ApJ, 825, 128 [Google Scholar]
- Leroy, A. K., Evans, A. S., Momjian, E., et al. 2011, ApJ, 739, L25 [NASA ADS] [CrossRef] [Google Scholar]
- Lucero, D. M., Carignan, C., Elson, E. C., et al. 2015, MNRAS, 450, 3935 [NASA ADS] [CrossRef] [Google Scholar]
- Maddox, N., Hess, K. M., Obreschkow, D., Jarvis, M. J., & Blyth, S.-L. 2015, MNRAS, 447, 1610 [Google Scholar]
- Makarov, D. I., & Karachentsev, I. D. 2009, Astrophys. Bull., 64, 24 [NASA ADS] [CrossRef] [Google Scholar]
- Makarov, D., & Karachentsev, I. 2011, MNRAS, 412, 2498 [NASA ADS] [CrossRef] [Google Scholar]
- Martin, J. M., Bottinelli, L., Dennefeld, M., & Gouguenheim, L. 1991, A&A, 245, 393 [NASA ADS] [Google Scholar]
- Martinsson, T. P. K., Verheijen, M. A. W., Bershady, M. A., et al. 2016, A&A, 585, A99 [NASA ADS] [CrossRef] [EDP Sciences] [Google Scholar]
- Meier, D. S., Turner, J. L., Beck, S. C., et al. 2009, AAS Meet. Abstr., 213, 445.03 [Google Scholar]
- Meier, D. S., Turner, J. L., Beck, S. C., et al. 2010, AJ, 140, 1294 [Google Scholar]
- Meier, D. S., Turner, J. L., & Beck, S. C. 2014, ApJ, 795, 107 [Google Scholar]
- Montuori, M., Di Matteo, P., Lehnert, M. D., Combes, F., & Semelin, B. 2010, A&A, 518, A56 [NASA ADS] [CrossRef] [EDP Sciences] [Google Scholar]
- Neugebauer, G., Habing, H. J., van Duinen, R., et al. 1984, ApJ, 278, L1 [NASA ADS] [CrossRef] [Google Scholar]
- Patton, D. R., Torrey, P., Ellison, S. L., Mendel, J. T., & Scudder, J. M. 2013, MNRAS, 433, L59 [CrossRef] [Google Scholar]
- Perrott, Y. C., Scaife, A. M. M., Green, D. A., et al. 2015, MNRAS, 453, 1396 [NASA ADS] [CrossRef] [Google Scholar]
- Privon, G. C. 2014, Ph.D. Thesis, University of Virginia [Google Scholar]
- Privon, G. C., Evans, A. S., Hibbard, J. E., et al. 2015, AAS Meet. Abstr., 225, 411.01 [Google Scholar]
- Reynolds, T. N., Catinella, B., Cortese, L., et al. 2022, MNRAS, 510, 1716 [Google Scholar]
- Sanders, D. B., & Mirabel, I. F. 1996, ARA&A, 34, 749 [Google Scholar]
- Sanders, D. B., Mazzarella, J. M., Kim, D.-C., Surace, J. A., & Soifer, B. T. 2003, AJ, 126, 1607 [Google Scholar]
- Schlafly, E. F., & Finkbeiner, D. P. 2011, ApJ, 737, 103 [Google Scholar]
- Scudder, J. M., Ellison, S. L., Torrey, P., Patton, D. R., & Mendel, J. T. 2012, MNRAS, 426, 549 [NASA ADS] [CrossRef] [Google Scholar]
- Serra, P., Westmeier, T., Giese, N., et al. 2015, MNRAS, 448, 1922 [Google Scholar]
- Šiljeg, B., Adams, E. A. K., Oosterloo, T. A., et al. 2026, A&A, 708, A40 [NASA ADS] [CrossRef] [EDP Sciences] [Google Scholar]
- Stein, Y., Vollmer, B., Boch, T., et al. 2021, A&A, 655, A17 [NASA ADS] [CrossRef] [EDP Sciences] [Google Scholar]
- Stein, Y., Vollmer, B., Boch, T., et al. 2020, VizieR On-line Data Catalog: VIII/104 [Google Scholar]
- Swaters, R. A., van Albada, T. S., van der Hulst, J. M., & Sancisi, R. 2002, A&A, 390, 829 [NASA ADS] [CrossRef] [EDP Sciences] [Google Scholar]
- Taylor, E. N., Hopkins, A. M., Baldry, I. K., et al. 2011, MNRAS, 418, 1587 [Google Scholar]
- van Albada, T. S., & Sancisi, R. 1986, Philos. Trans. R. Soc. Lond. Ser. A, 320, 447 [Google Scholar]
- Wechsler, R. H., & Tinker, J. L. 2018, ARA&A, 56, 435 [NASA ADS] [CrossRef] [Google Scholar]
- Westmeier, T., Kitaeff, S., Pallot, D., et al. 2021, MNRAS, 506, 3962 [NASA ADS] [CrossRef] [Google Scholar]
- Willmer, C. N. A. 2018, ApJS, 236, 47 [Google Scholar]
- Wyder, T. K., Martin, D. C., Schiminovich, D., et al. 2007, ApJS, 173, 293 [Google Scholar]
- Yu, N., Ho, L. C., & Wang, J. 2020, ApJ, 898, 102 [NASA ADS] [CrossRef] [Google Scholar]
- Yun, M. S., Ho, P. T. P., & Lo, K. Y. 1994, Nature, 372, 530 [NASA ADS] [CrossRef] [Google Scholar]
- Zhang, C.-P., Zhu, M., Jiang, P., et al. 2024, Sci. China: Phys. Mech. Astron., 67, 219511 [Google Scholar]
- Zibetti, S., Charlot, S., & Rix, H.-W. 2009, MNRAS, 400, 1181 [NASA ADS] [CrossRef] [Google Scholar]
- Zuo, P., Ho, L. C., Wang, J., Yu, N., & Shangguan, J. 2022, ApJ, 929, 15 [Google Scholar]
Appendix A: Additional material
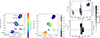 |
Fig. A.1. H I moment 0 (integrated intensity) and moment 1 (velocity field) maps and PV diagrams from FAST observations. The maps and diagrams are derived from the FAST H I data cube, illustrating both the gas distribution and kinematic structure. The purple regions in the left panels mark the selected areas used to extract the H I line profiles of each source: HI 0431+2947, HI 0432+2944, IRAS 04296+2923, HI 0432+2926, and HI 0433+2909. Due to the limited spatial resolution of FAST, HI 0431+2947 and HI 0432+2944 partially overlap. The PV diagrams on the right were obtained using BBAROLO along the purple solid line (center: 04h32m41.3s, +29°27′55.2″, PA = 328°, length = 50 arcmin). |
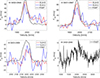 |
Fig. A.2. H I line profiles of H I 0431+2947, H I 0432+2944, H I 0433+2909, and H I 0430+2846. The spectra are obtained from VLA-C, VLA-D, and FAST observations. |
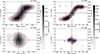 |
Fig. A.3. PV diagrams of HI 0432+2926 from VLA-D (left) and VLA-C (right) observations. The diagrams are generated from the H I data cubes using the 3D-BAROLO fitting software. The blue contours show the observed data, while the red contours indicate the best-fit model results. The yellow dots mark the fit rotation curve derived from the model. The angles (ϕ) in the upper right corners denote the position angles obtained from the kinematic fitting. |
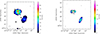 |
Fig. A.4. Velocity dispersion (moment 2) maps of IRAS 04296+2923 and HI 0432+2926. Left: Map derived from the VLA-D configuration data. Right: That from the VLA-C configuration data. |
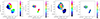 |
Fig. A.5. Velocity field (moment 1; top), and velocity dispersion (moment 2; bottom) maps of IRAS 04296+2923 and HI 0432+2926. The maps are derived from VLA-D (left two panels) and VLA-C (right two panels) configuration H I data using SOFIA. |
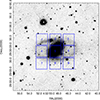 |
Fig. A.6. I-band optical image of IRAS 0432+2926 from the Pan-STARRS survey. The blue square boxes mark the regions selected for extracting H I line profiles. Each region measures 30″ × 30″, with central coordinates listed in Table A.1. The corresponding H I spectra are shown in Fig. A.7, and the fit parameters are presented in Table A.1. |
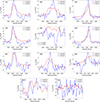 |
Fig. A.7. H I line profiles extracted from regions 1–11, as marked in Figs. 5 and A.6. The fitting parameters are listed in Table A.1. |
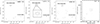 |
Fig. A.8. Radio continuum contour maps of IRAS 04296+2923 at 1.4, 3, 5, and 43 GHz. The project name and observing frequency are indicated in the upper right corner of each panel, and additional information on these datasets is provided in Table 2. The contour levels are: 1.4 GHz: 1.5×(1, 2, 4, 8) mJy beam−1; 3 GHz: 0.6×(1, 2, 4, 8) mJy beam−1; 5 GHz: 1.5×(1, 2, 4, 8) mJy beam−1; 43 GHz: 2.7×(1, 2, 4, 8) mJy beam−1. The lowest contour corresponds to the 3σ level in each map. |
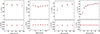 |
Fig. A.9. Radial profiles of rotation velocity (Vrot, top) and systemic velocity (Vsys, bottom) for IRAS 04296+2923 and HI 0432+2926, derived from VLA-D (left) and VLA-C (right) configuration H I data using 3D-BAROLO. Red points represent the best-fit model values, while gray points show the observed data. |
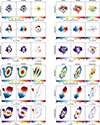 |
Fig. A.10. 3D-BAROLO modeling results for IRAS 04296+2923 (panels a and b) and H I 0432+2926 (panels c and d), based on the VLA D- and C-configuration H I data. For each subpanel, the columns show (from left to right) the observed data, the best-fit model, and the residuals for the integrated intensity (top row), velocity field (middle row), and velocity dispersion (bottom row). |
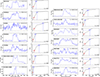 |
Fig. A.11. H I spectra and line concentration parameter (Cv = V85/V25) for early-stage merging galaxies from Larson et al. (2016). Panel (a): H I spectra (left column) and cumulative rotation curves (right column) for five M1-stage mergers, with data retrieved from the NED database except for NGC 3110 (Haynes et al. 2018). Panel (b): Same for seven M2-stage mergers, with MCG 02-01-051 from Martin et al. (1991); all others are from NED. Curves of growth are constructed following the method in Zuo et al. (2022). |
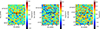 |
Fig. A.12. VLASS 3 GHz continuum images of the H I galaxies H I 0433+2909, H I 0431+2947, and H I 0432+2944 (see Table 3). The black crosses indicate the optical coordinates listed in Table 3. The rms noise in the images is approximately 0.2 mJy beam−1. |
Parameters of the HI emission line regions in IRAS 04296+2923.
All Tables
All Figures
|
Fig. 1. H I emission contours overlaid on Pan-STARRS optical images of IRAS 04296+2923 and its galaxy group members. Red, blue, and black contours represent the combined H I total intensity (moment 0) maps from the VLA D-array, VLA C-array, and FAST observations, respectively. White contours in the upper left panel indicate central H I absorption toward IRAS 04296+2923 as detected in the VLA C-array data. For the left panel, the contour levels are: red: 0.03, 0.06, 0.12, 0.24, 0.48, 0.96, 1.30, and 1.54 Jy beam−1 km s−1; blue: 0.09, 0.18, and 0.36 Jy beam−1 km s−1; black: 0.10, 0.20, 0.40, 0.80, 1.60, and 3.20 Jy beam−1 km s−1; white (absorption): −0.30, −0.40, −0.50, and −0.60 Jy beam−1 km s−1. For the remaining panels, the contour levels are: red: 0.40, 0.80, and 1.60 Jy beam−1 km s−1; blue: 0.18, 0.36, and 0.72 Jy beam−1 km s−1; black: 0.10, 0.20, 0.40, 0.80, 1.60, and 3.20 Jy beam−1 km s−1. In all panels, the lowest contour corresponds to the 3σ level. White and red crosses mark the optical and H I centroid positions of the detected sources listed in Table 3. Insets show zoomed-in optical views of the individual galaxies. The lower left inset indicates the synthesized beam sizes for each dataset (see Table 1 for beam parameters). |
| In the text | |
|
Fig. 2. H I line profiles from VLA-C, VLA-D, and FAST observations of IRAS 04296+2923 (left) and HI 0432+2926 (right). For IRAS 04296+2923, the H I emission lines were extracted from a circular region with a diameter of 3.4′, centered at RA = 04h32m48.9s, Dec = +29° 29′53.1″. The H I absorption spectrum was obtained from a box region centered at RA = 04h32m48.6s, Dec = +29° 29′57.4″, with a size of about 20″ × 20″. The black line represents the Nançay H I data from Chamaraux et al. (1995). For HI 0432+2926, the H I emission lines were extracted from a box region centered at RA = 04h32m33.7s, Dec = +29° 26′26.5″, with a size of about 2.5′ × 4.1′. Because the angular resolution of the FAST telescope is relatively low, the two galaxies cannot be fully separated in the FAST H I image. Therefore, the FAST H I line profiles were extracted from two box regions, as indicated in Fig. A.1. In the left panel, the y axis of the H I absorption line is shown on the right, while those of the emission lines are on the left. |
| In the text | |
|
Fig. 3. Velocity (moment 1) maps of IRAS 04296+2923 and HI 0432+2926. Left and middle: Velocity fields derived from the VLA-D and VLA-C array data, respectively. Right: Velocity map from the FAST H I survey data, with red contours representing the H I emission from the VLA-D project, as shown in Fig. 1. The synthesized beam of each observation is shown in the lower left corner of each panel. |
| In the text | |
|
Fig. 4. PV diagrams of IRAS 04296+2923 from VLA-D (left) and VLA-C (right) observations. The diagrams are generated from the H I data cubes using the 3D-BAROLO fitting software. The blue contours show the observed data, while the red contours indicate the best-fit model results. The yellow dots mark the fit rotation curve derived from the model. The angles (ϕ) in the upper right corners denote the position angles obtained from the kinematic fitting. The gray contour at the center of the right panels highlights the region where strong H I absorption is detected in the C-configuration data. |
| In the text | |
|
Fig. 5. Integrated intensity (moment 0) map of IRAS 04296+2923 (upper left) and HI 0432+2926 (lower right). The maps are derived from the VLA–D array H I data using SOFIA. The white contours show the 3σ H I emission from the same VLA–D data, identical to those displayed in Fig. 1. Region 11 (green box) covers an area of 3′ × 2′, while region 10 (green circle) covers 100″ × 100″. The corresponding H I spectral profiles extracted from these regions are presented in Fig. A.7, and the fit parameters are summarized in Table A.1. |
| In the text | |
|
Fig. 6. Multiband integrated flux densities of IRAS 04296+2923. The values are listed in Table 2. The solid line represents the best-fitting model described by Eq. (1). The dashed and dash-dotted lines indicate the thermal (free-free) and nonthermal (synchrotron) components, respectively. |
| In the text | |
|
Fig. 7. Radial H I surface density profiles of IRAS 04296+2923 and H I 0432+2926. For each galaxy, the profiles derived from the VLA–D and VLA–C configurations are shown in red and blue, respectively, with solid lines representing IRAS 04296+2923 and dashed lines representing H I 0432+2926. For comparison, the H I radial profile of NGC 253 from the KAT-7 observations (Lucero et al. 2015) is plotted as the solid black line. |
| In the text | |
|
Fig. A.1. H I moment 0 (integrated intensity) and moment 1 (velocity field) maps and PV diagrams from FAST observations. The maps and diagrams are derived from the FAST H I data cube, illustrating both the gas distribution and kinematic structure. The purple regions in the left panels mark the selected areas used to extract the H I line profiles of each source: HI 0431+2947, HI 0432+2944, IRAS 04296+2923, HI 0432+2926, and HI 0433+2909. Due to the limited spatial resolution of FAST, HI 0431+2947 and HI 0432+2944 partially overlap. The PV diagrams on the right were obtained using BBAROLO along the purple solid line (center: 04h32m41.3s, +29°27′55.2″, PA = 328°, length = 50 arcmin). |
| In the text | |
|
Fig. A.2. H I line profiles of H I 0431+2947, H I 0432+2944, H I 0433+2909, and H I 0430+2846. The spectra are obtained from VLA-C, VLA-D, and FAST observations. |
| In the text | |
|
Fig. A.3. PV diagrams of HI 0432+2926 from VLA-D (left) and VLA-C (right) observations. The diagrams are generated from the H I data cubes using the 3D-BAROLO fitting software. The blue contours show the observed data, while the red contours indicate the best-fit model results. The yellow dots mark the fit rotation curve derived from the model. The angles (ϕ) in the upper right corners denote the position angles obtained from the kinematic fitting. |
| In the text | |
|
Fig. A.4. Velocity dispersion (moment 2) maps of IRAS 04296+2923 and HI 0432+2926. Left: Map derived from the VLA-D configuration data. Right: That from the VLA-C configuration data. |
| In the text | |
|
Fig. A.5. Velocity field (moment 1; top), and velocity dispersion (moment 2; bottom) maps of IRAS 04296+2923 and HI 0432+2926. The maps are derived from VLA-D (left two panels) and VLA-C (right two panels) configuration H I data using SOFIA. |
| In the text | |
|
Fig. A.6. I-band optical image of IRAS 0432+2926 from the Pan-STARRS survey. The blue square boxes mark the regions selected for extracting H I line profiles. Each region measures 30″ × 30″, with central coordinates listed in Table A.1. The corresponding H I spectra are shown in Fig. A.7, and the fit parameters are presented in Table A.1. |
| In the text | |
|
Fig. A.7. H I line profiles extracted from regions 1–11, as marked in Figs. 5 and A.6. The fitting parameters are listed in Table A.1. |
| In the text | |
|
Fig. A.8. Radio continuum contour maps of IRAS 04296+2923 at 1.4, 3, 5, and 43 GHz. The project name and observing frequency are indicated in the upper right corner of each panel, and additional information on these datasets is provided in Table 2. The contour levels are: 1.4 GHz: 1.5×(1, 2, 4, 8) mJy beam−1; 3 GHz: 0.6×(1, 2, 4, 8) mJy beam−1; 5 GHz: 1.5×(1, 2, 4, 8) mJy beam−1; 43 GHz: 2.7×(1, 2, 4, 8) mJy beam−1. The lowest contour corresponds to the 3σ level in each map. |
| In the text | |
|
Fig. A.9. Radial profiles of rotation velocity (Vrot, top) and systemic velocity (Vsys, bottom) for IRAS 04296+2923 and HI 0432+2926, derived from VLA-D (left) and VLA-C (right) configuration H I data using 3D-BAROLO. Red points represent the best-fit model values, while gray points show the observed data. |
| In the text | |
|
Fig. A.10. 3D-BAROLO modeling results for IRAS 04296+2923 (panels a and b) and H I 0432+2926 (panels c and d), based on the VLA D- and C-configuration H I data. For each subpanel, the columns show (from left to right) the observed data, the best-fit model, and the residuals for the integrated intensity (top row), velocity field (middle row), and velocity dispersion (bottom row). |
| In the text | |
|
Fig. A.11. H I spectra and line concentration parameter (Cv = V85/V25) for early-stage merging galaxies from Larson et al. (2016). Panel (a): H I spectra (left column) and cumulative rotation curves (right column) for five M1-stage mergers, with data retrieved from the NED database except for NGC 3110 (Haynes et al. 2018). Panel (b): Same for seven M2-stage mergers, with MCG 02-01-051 from Martin et al. (1991); all others are from NED. Curves of growth are constructed following the method in Zuo et al. (2022). |
| In the text | |
|
Fig. A.12. VLASS 3 GHz continuum images of the H I galaxies H I 0433+2909, H I 0431+2947, and H I 0432+2944 (see Table 3). The black crosses indicate the optical coordinates listed in Table 3. The rms noise in the images is approximately 0.2 mJy beam−1. |
| In the text | |
Current usage metrics show cumulative count of Article Views (full-text article views including HTML views, PDF and ePub downloads, according to the available data) and Abstracts Views on Vision4Press platform.
Data correspond to usage on the plateform after 2015. The current usage metrics is available 48-96 hours after online publication and is updated daily on week days.
Initial download of the metrics may take a while.