Fig. A.10.
Download original image
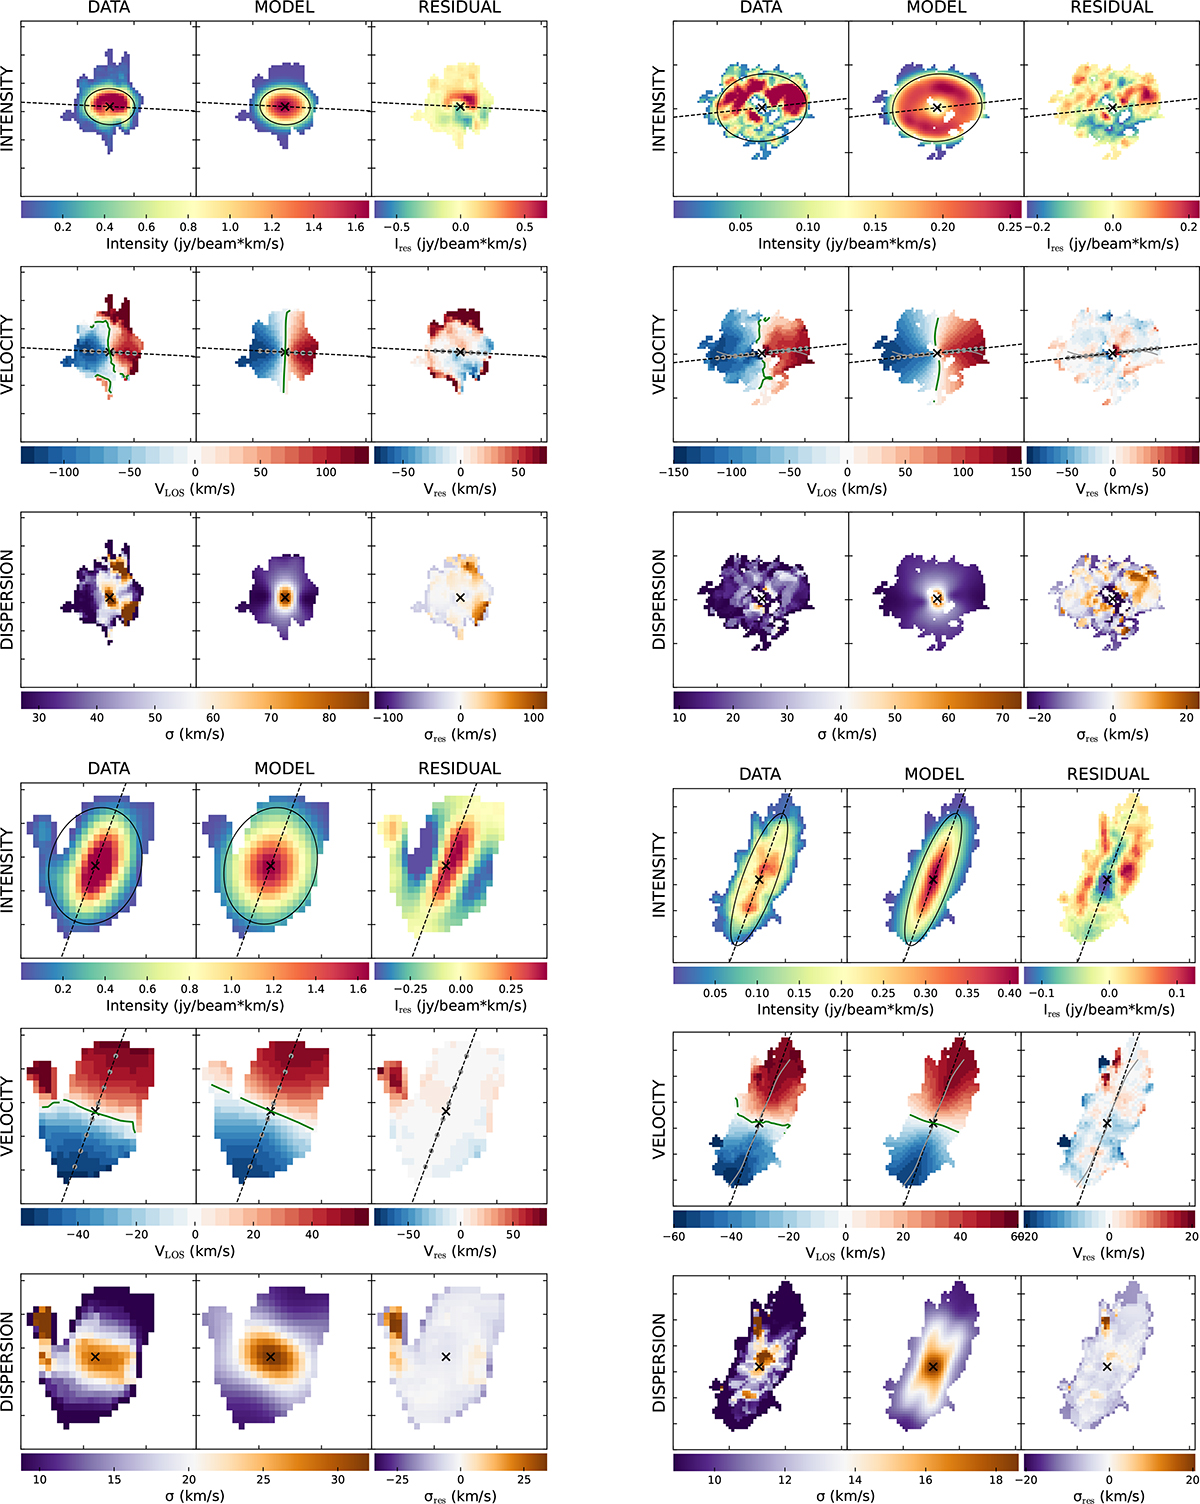
3D-BAROLO modeling results for IRAS 04296+2923 (panels a and b) and H I 0432+2926 (panels c and d), based on the VLA D- and C-configuration H I data. For each subpanel, the columns show (from left to right) the observed data, the best-fit model, and the residuals for the integrated intensity (top row), velocity field (middle row), and velocity dispersion (bottom row).
Current usage metrics show cumulative count of Article Views (full-text article views including HTML views, PDF and ePub downloads, according to the available data) and Abstracts Views on Vision4Press platform.
Data correspond to usage on the plateform after 2015. The current usage metrics is available 48-96 hours after online publication and is updated daily on week days.
Initial download of the metrics may take a while.