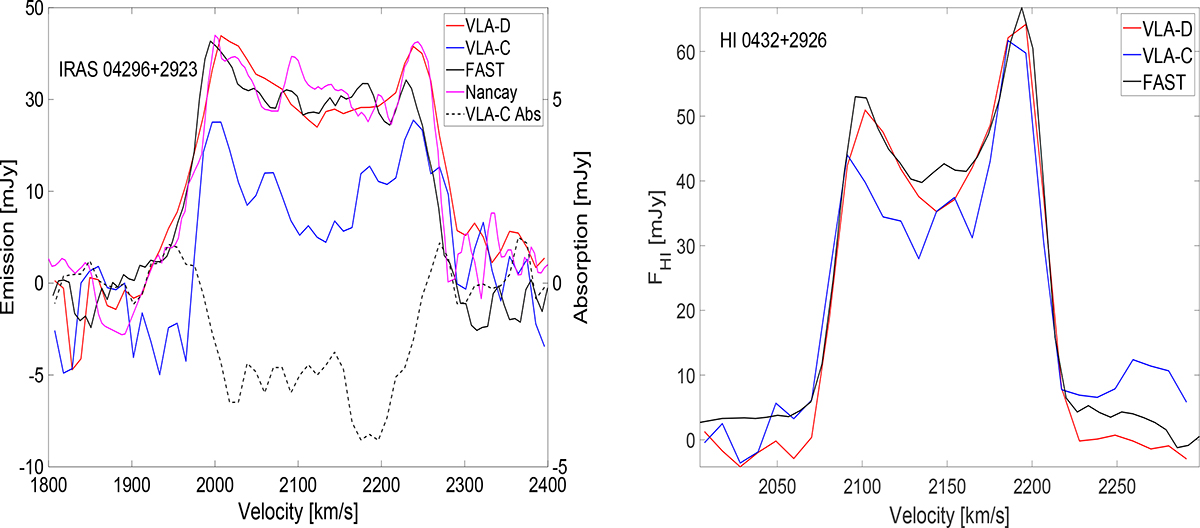
Fig. 2.
Download original image
H I line profiles from VLA-C, VLA-D, and FAST observations of IRAS 04296+2923 (left) and HI 0432+2926 (right). For IRAS 04296+2923, the H I emission lines were extracted from a circular region with a diameter of 3.4′, centered at RA = 04h32m48.9s, Dec = +29° 29′53.1″. The H I absorption spectrum was obtained from a box region centered at RA = 04h32m48.6s, Dec = +29° 29′57.4″, with a size of about 20″ × 20″. The black line represents the Nançay H I data from Chamaraux et al. (1995). For HI 0432+2926, the H I emission lines were extracted from a box region centered at RA = 04h32m33.7s, Dec = +29° 26′26.5″, with a size of about 2.5′ × 4.1′. Because the angular resolution of the FAST telescope is relatively low, the two galaxies cannot be fully separated in the FAST H I image. Therefore, the FAST H I line profiles were extracted from two box regions, as indicated in Fig. A.1. In the left panel, the y axis of the H I absorption line is shown on the right, while those of the emission lines are on the left.
Current usage metrics show cumulative count of Article Views (full-text article views including HTML views, PDF and ePub downloads, according to the available data) and Abstracts Views on Vision4Press platform.
Data correspond to usage on the plateform after 2015. The current usage metrics is available 48-96 hours after online publication and is updated daily on week days.
Initial download of the metrics may take a while.