Fig. 4.
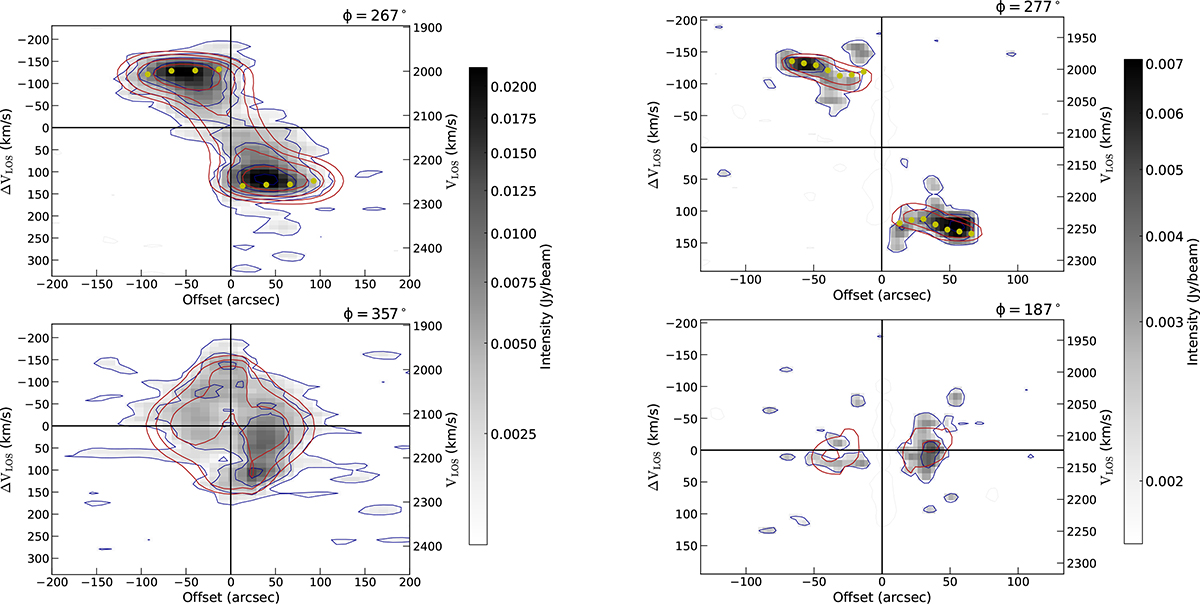
Download original image
PV diagrams of IRAS 04296+2923 from VLA-D (left) and VLA-C (right) observations. The diagrams are generated from the H I data cubes using the 3D-BAROLO fitting software. The blue contours show the observed data, while the red contours indicate the best-fit model results. The yellow dots mark the fit rotation curve derived from the model. The angles (ϕ) in the upper right corners denote the position angles obtained from the kinematic fitting. The gray contour at the center of the right panels highlights the region where strong H I absorption is detected in the C-configuration data.
Current usage metrics show cumulative count of Article Views (full-text article views including HTML views, PDF and ePub downloads, according to the available data) and Abstracts Views on Vision4Press platform.
Data correspond to usage on the plateform after 2015. The current usage metrics is available 48-96 hours after online publication and is updated daily on week days.
Initial download of the metrics may take a while.