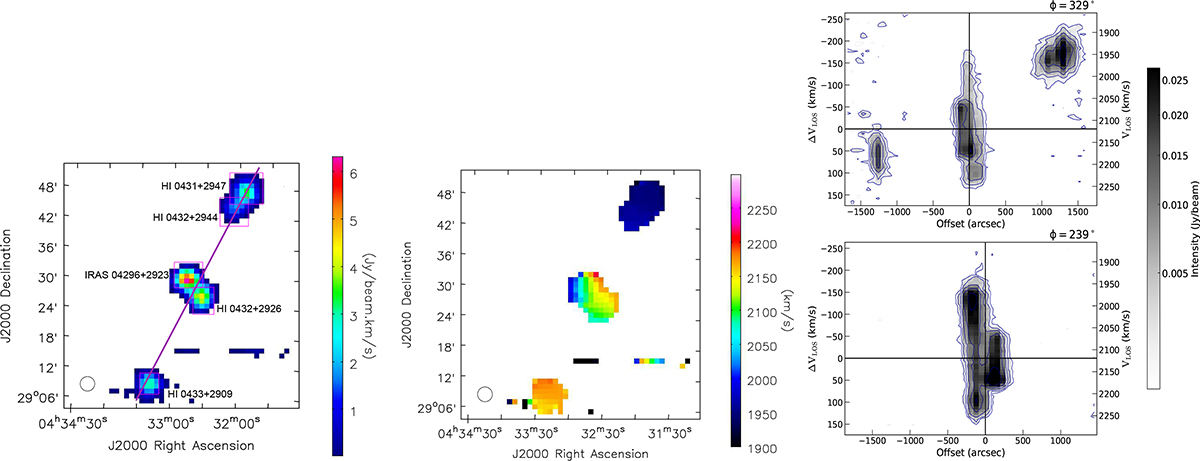
Fig. A.1.
Download original image
H I moment 0 (integrated intensity) and moment 1 (velocity field) maps and PV diagrams from FAST observations. The maps and diagrams are derived from the FAST H I data cube, illustrating both the gas distribution and kinematic structure. The purple regions in the left panels mark the selected areas used to extract the H I line profiles of each source: HI 0431+2947, HI 0432+2944, IRAS 04296+2923, HI 0432+2926, and HI 0433+2909. Due to the limited spatial resolution of FAST, HI 0431+2947 and HI 0432+2944 partially overlap. The PV diagrams on the right were obtained using BBAROLO along the purple solid line (center: 04h32m41.3s, +29°27′55.2″, PA = 328°, length = 50 arcmin).
Current usage metrics show cumulative count of Article Views (full-text article views including HTML views, PDF and ePub downloads, according to the available data) and Abstracts Views on Vision4Press platform.
Data correspond to usage on the plateform after 2015. The current usage metrics is available 48-96 hours after online publication and is updated daily on week days.
Initial download of the metrics may take a while.