Fig. 1
Download original image
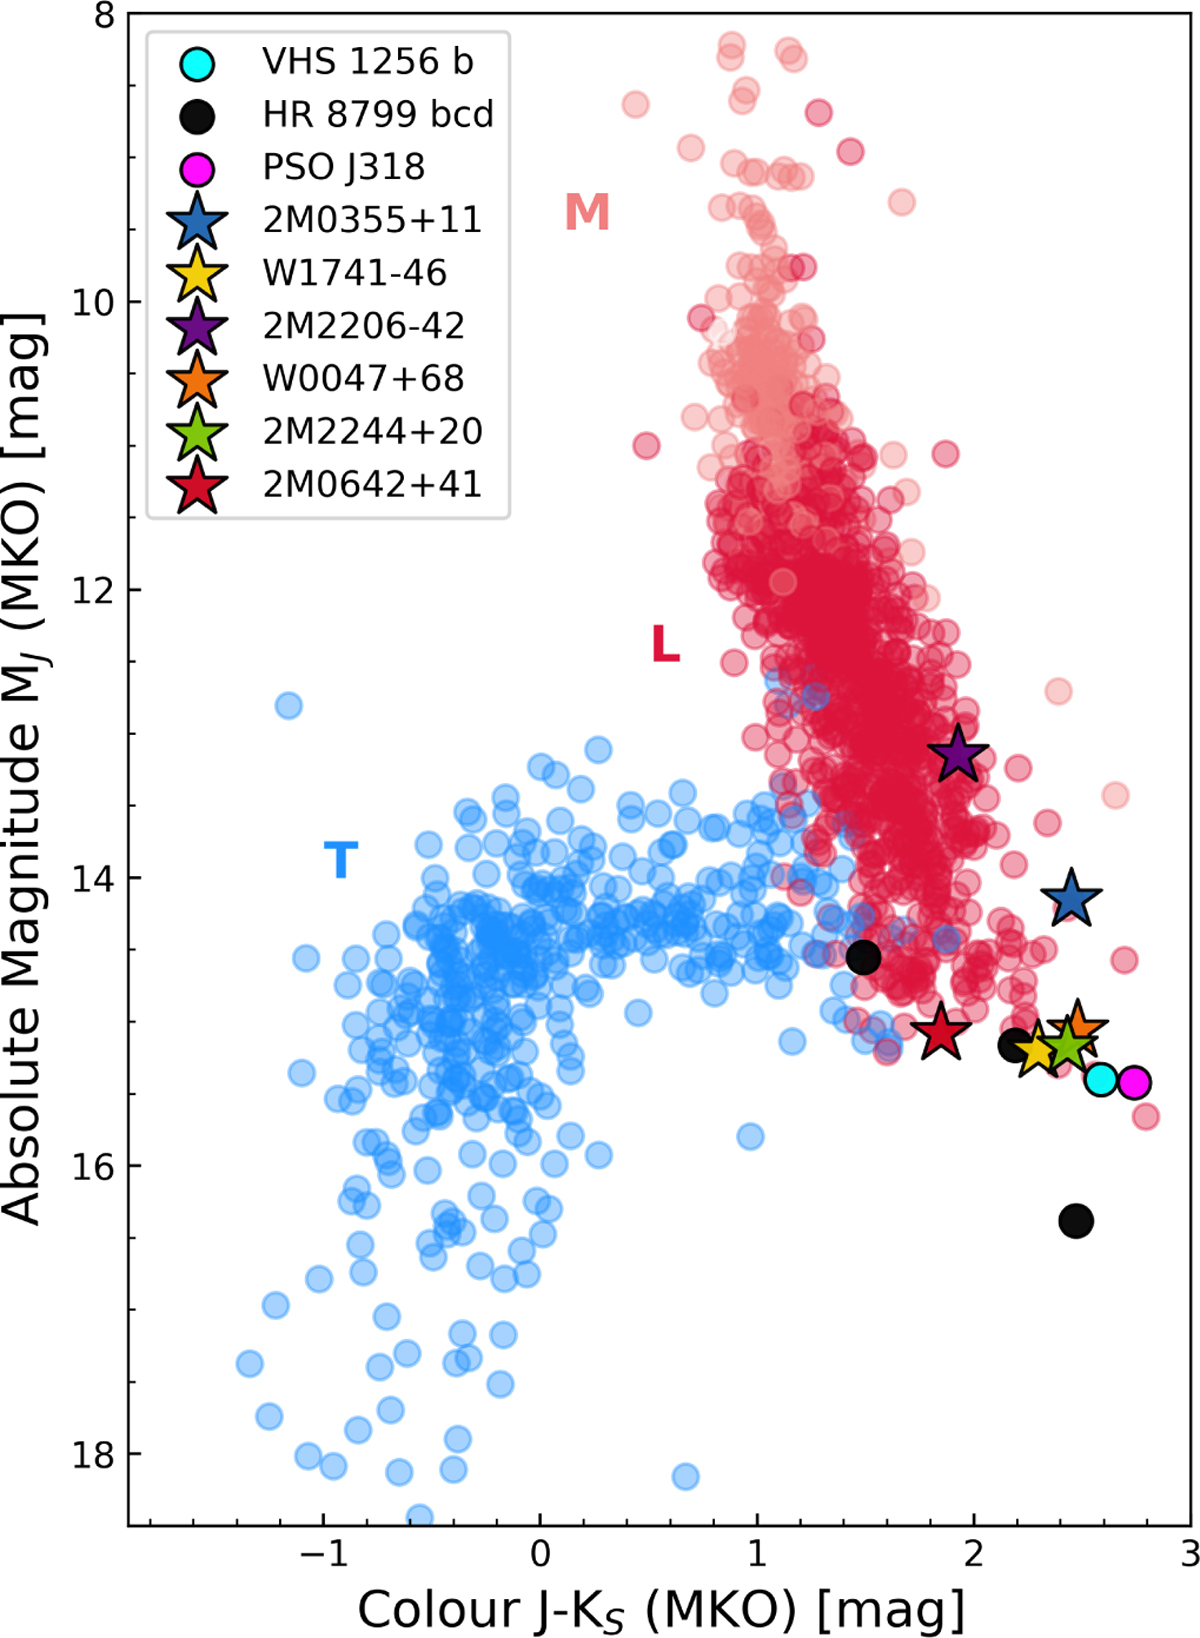
Colour-magnitude diagram indicating locations of our targets (coloured stars) at the L-T transition. The location of VHS 1256 b has also been included as a cyan circle. Planets in the HR 8799 system are also indicated as black circles. PSO J318 is indicated as a pink circle. The coral points are M dwarfs, dark red points are L dwarfs, and blue points are T dwarfs. Photometric data for each point was obtained from the Ultracool Sheet (Best et al. 2024).
Current usage metrics show cumulative count of Article Views (full-text article views including HTML views, PDF and ePub downloads, according to the available data) and Abstracts Views on Vision4Press platform.
Data correspond to usage on the plateform after 2015. The current usage metrics is available 48-96 hours after online publication and is updated daily on week days.
Initial download of the metrics may take a while.