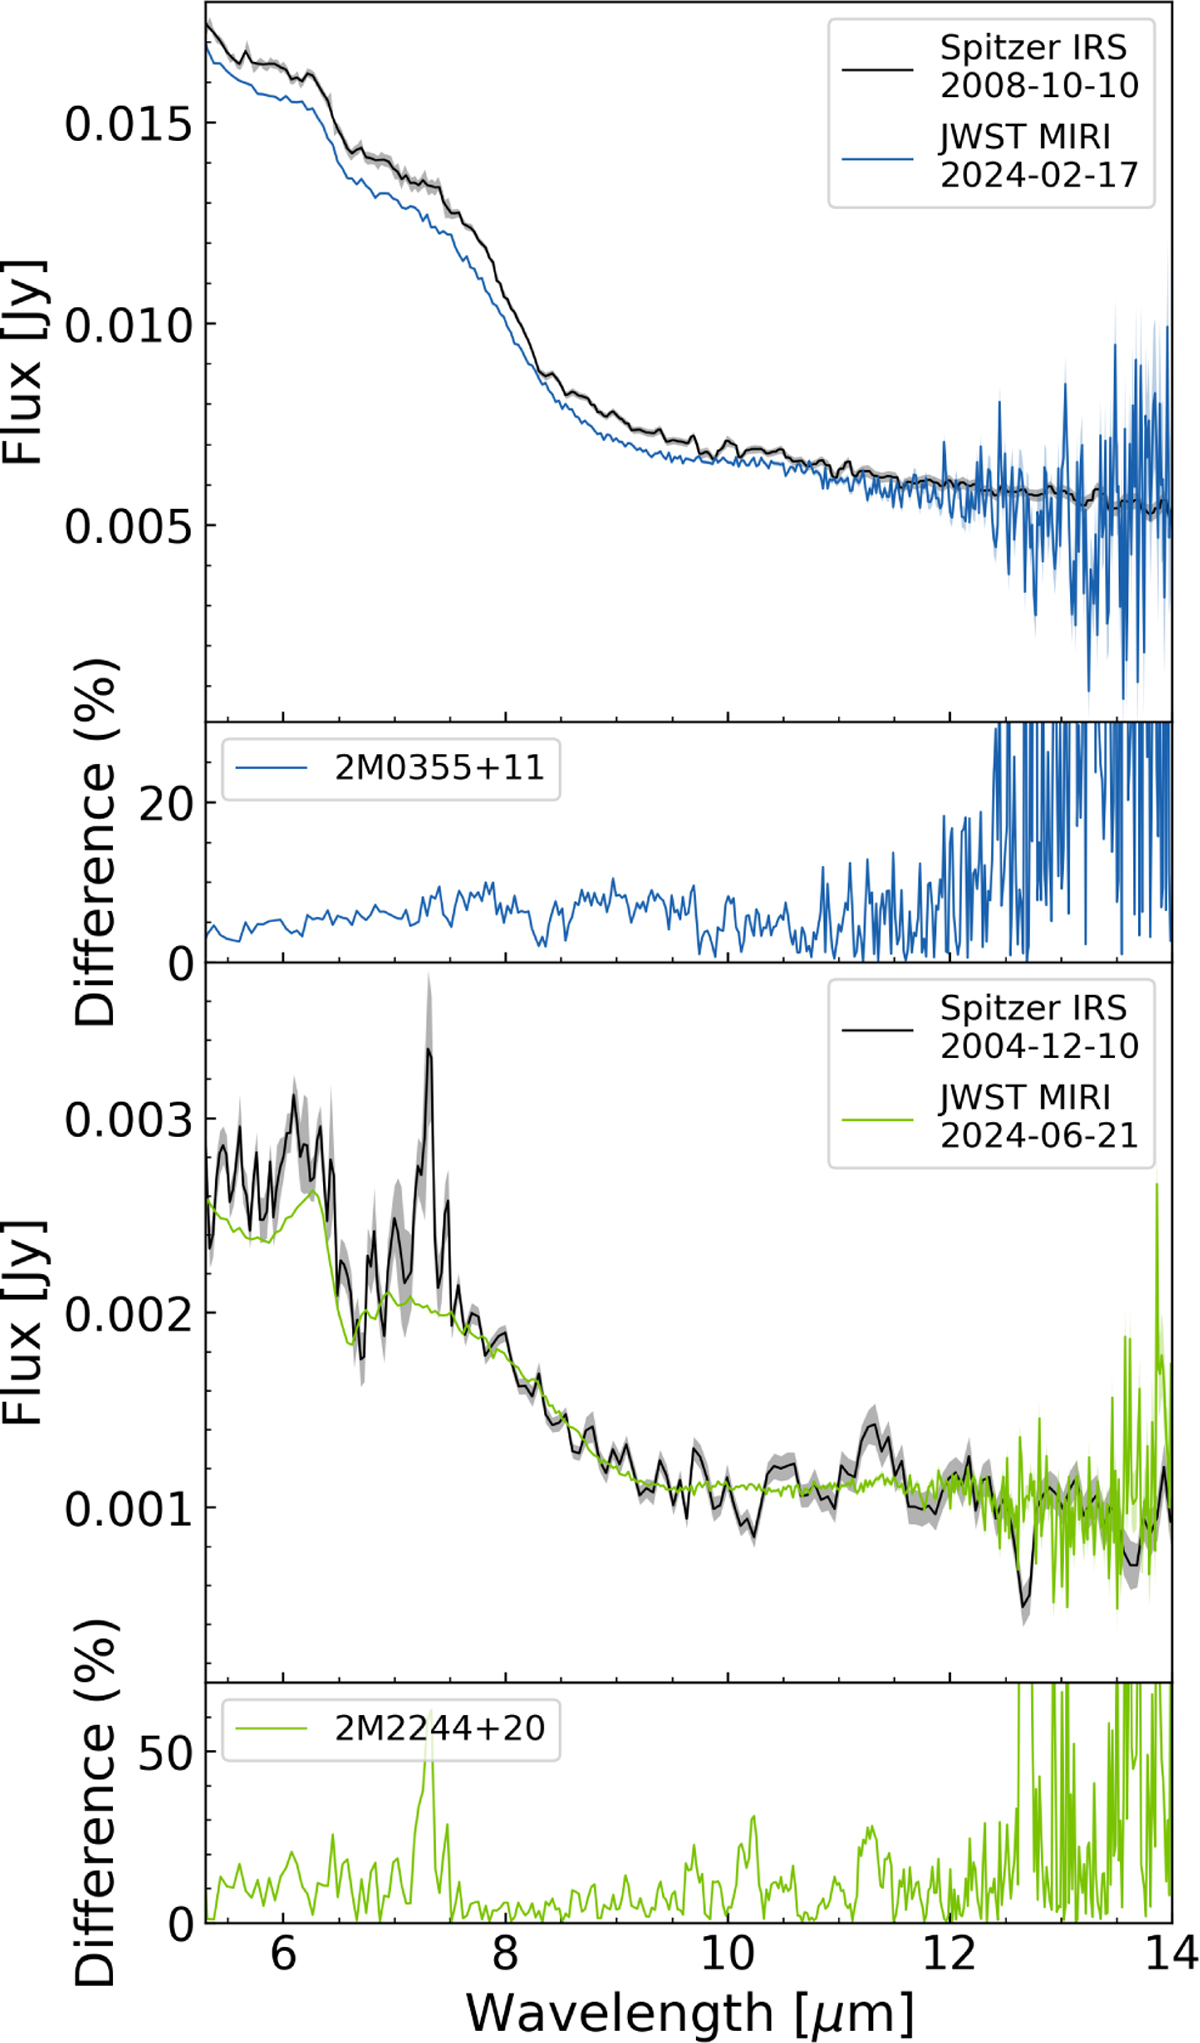
Fig. 10
Download original image
Spectral comparison between Spitzer IRS observations (Suárez & Metchev 2022) and our JWST MIRI LRS observations for 2M0355+11 and 2M2244+20. The Spitzer spectra are shown in black and our spectra are coloured. Top two panels: Comparison for 2M0355+11. Bottom two panels: Comparison for 2M2244+20. The uncertainties are shown as the shaded envelope region. Below each spectral comparison is the relative flux difference (max/min − 1).
Current usage metrics show cumulative count of Article Views (full-text article views including HTML views, PDF and ePub downloads, according to the available data) and Abstracts Views on Vision4Press platform.
Data correspond to usage on the plateform after 2015. The current usage metrics is available 48-96 hours after online publication and is updated daily on week days.
Initial download of the metrics may take a while.