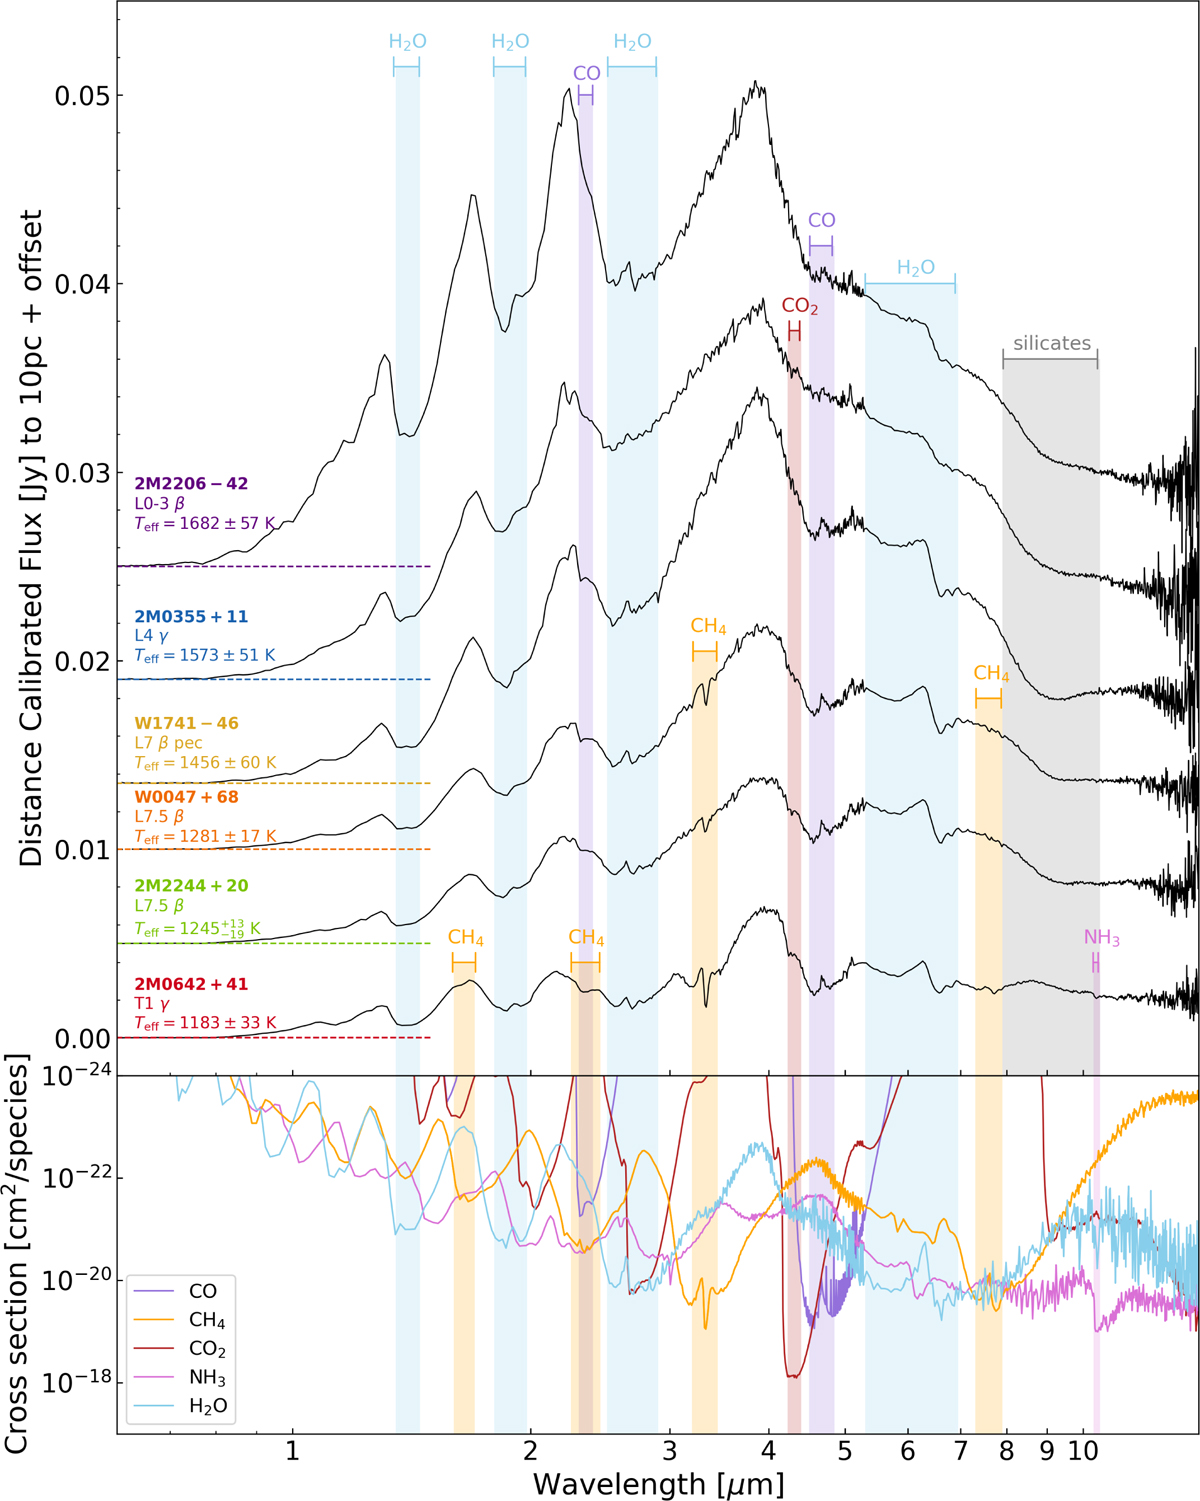
Fig. 2
Download original image
Top panel: distance-calibrated spectra for each object. Shaded regions show key absorption bands for CH4, CO, CO2, NH3 and H2O. The dotted line shows the offset level for each spectrum. The spectra are ordered by decreasing effective temperature from top to bottom. Bottom panel: cross-sections for each species, computed at T = 1300 K and P = 1 bar.
Current usage metrics show cumulative count of Article Views (full-text article views including HTML views, PDF and ePub downloads, according to the available data) and Abstracts Views on Vision4Press platform.
Data correspond to usage on the plateform after 2015. The current usage metrics is available 48-96 hours after online publication and is updated daily on week days.
Initial download of the metrics may take a while.