Fig. 5
Download original image
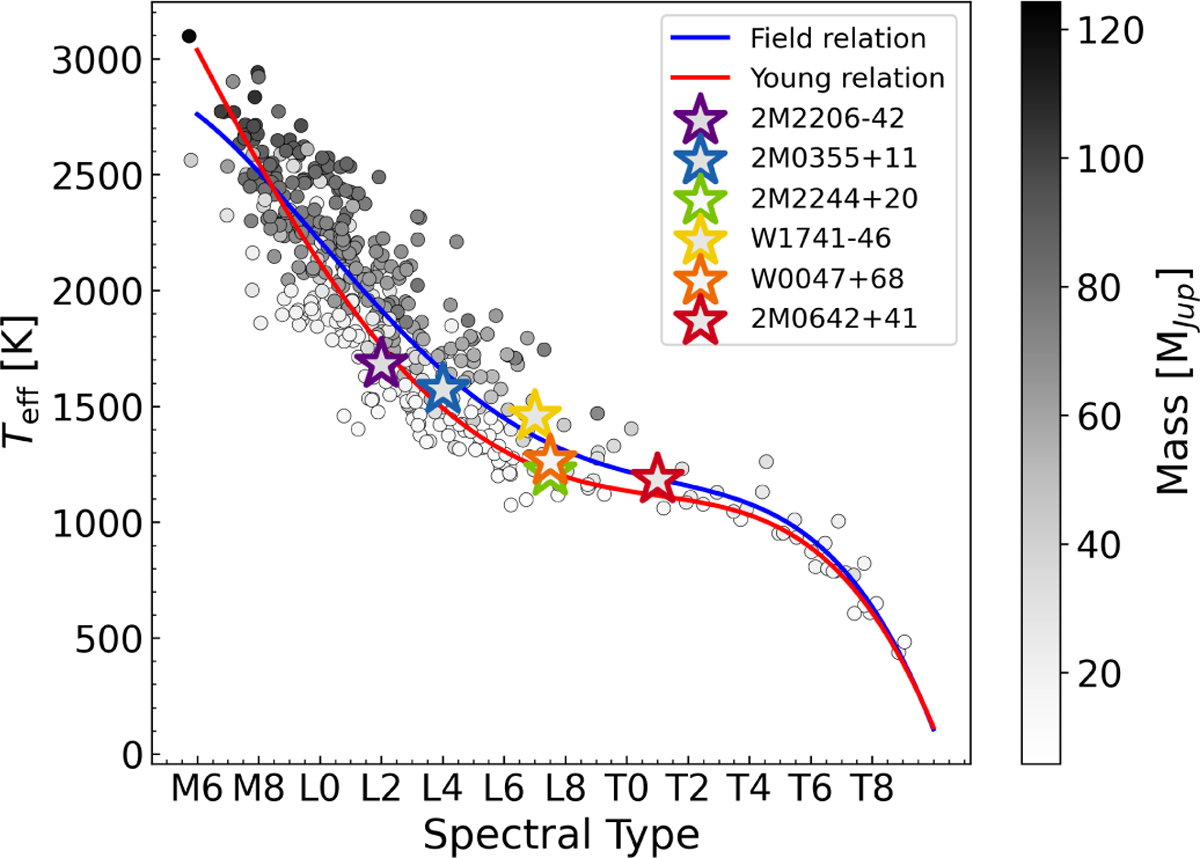
Visualisation of the fundamental parameters of the sample analysed in Sanghi et al. (2023, grey circles) and our sample (coloured outlined stars). We note that Teff is plotted against the IR spectral type. The fill colour is indicative of the mass of the object. Random noise of 0.3 spectral types was added along the x-axis to minimise overlapping points in visualisation. The fundamental parameters were calculated using evolutionary models. The polynomial relations for the old field dwarfs and young moving group members (blue and red lines, respectively) from Sanghi et al. (2023) are overplotted.
Current usage metrics show cumulative count of Article Views (full-text article views including HTML views, PDF and ePub downloads, according to the available data) and Abstracts Views on Vision4Press platform.
Data correspond to usage on the plateform after 2015. The current usage metrics is available 48-96 hours after online publication and is updated daily on week days.
Initial download of the metrics may take a while.