Fig. 6
Download original image
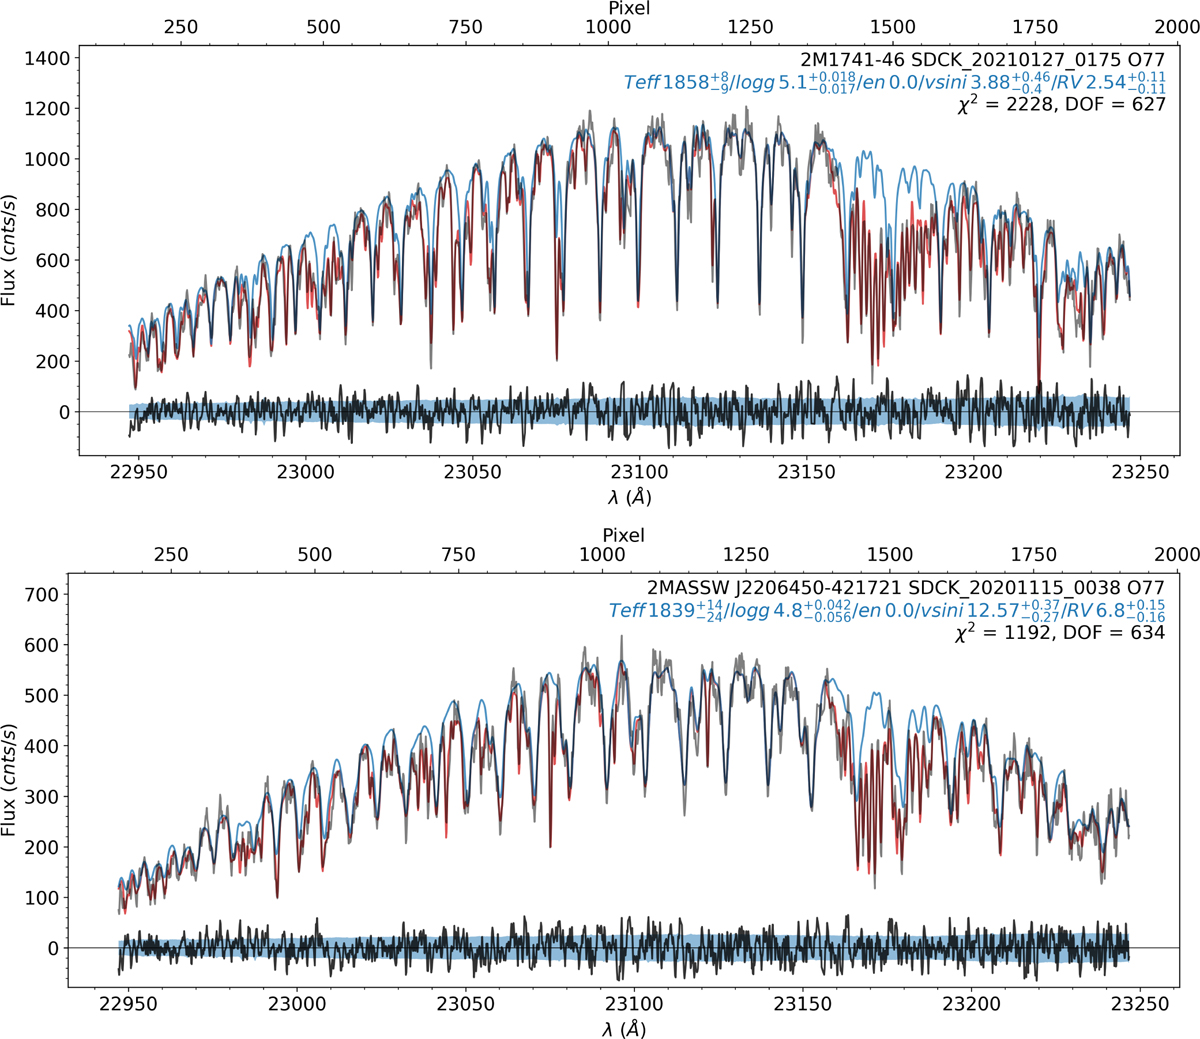
SMART fits to IGRINS spectra for W1741–46 (top) and 2M2206–42 (bottom). The grey line is the observed IGRINS spectra, the red line is the fitted model including telluric absorption, and the blue line is the fitted model without tellurics. At the bottom of each plot is the residual between the model (including tellurics) and the observed data. The shaded blue region is the ±1σ uncertainty.
Current usage metrics show cumulative count of Article Views (full-text article views including HTML views, PDF and ePub downloads, according to the available data) and Abstracts Views on Vision4Press platform.
Data correspond to usage on the plateform after 2015. The current usage metrics is available 48-96 hours after online publication and is updated daily on week days.
Initial download of the metrics may take a while.