Fig. 9
Download original image
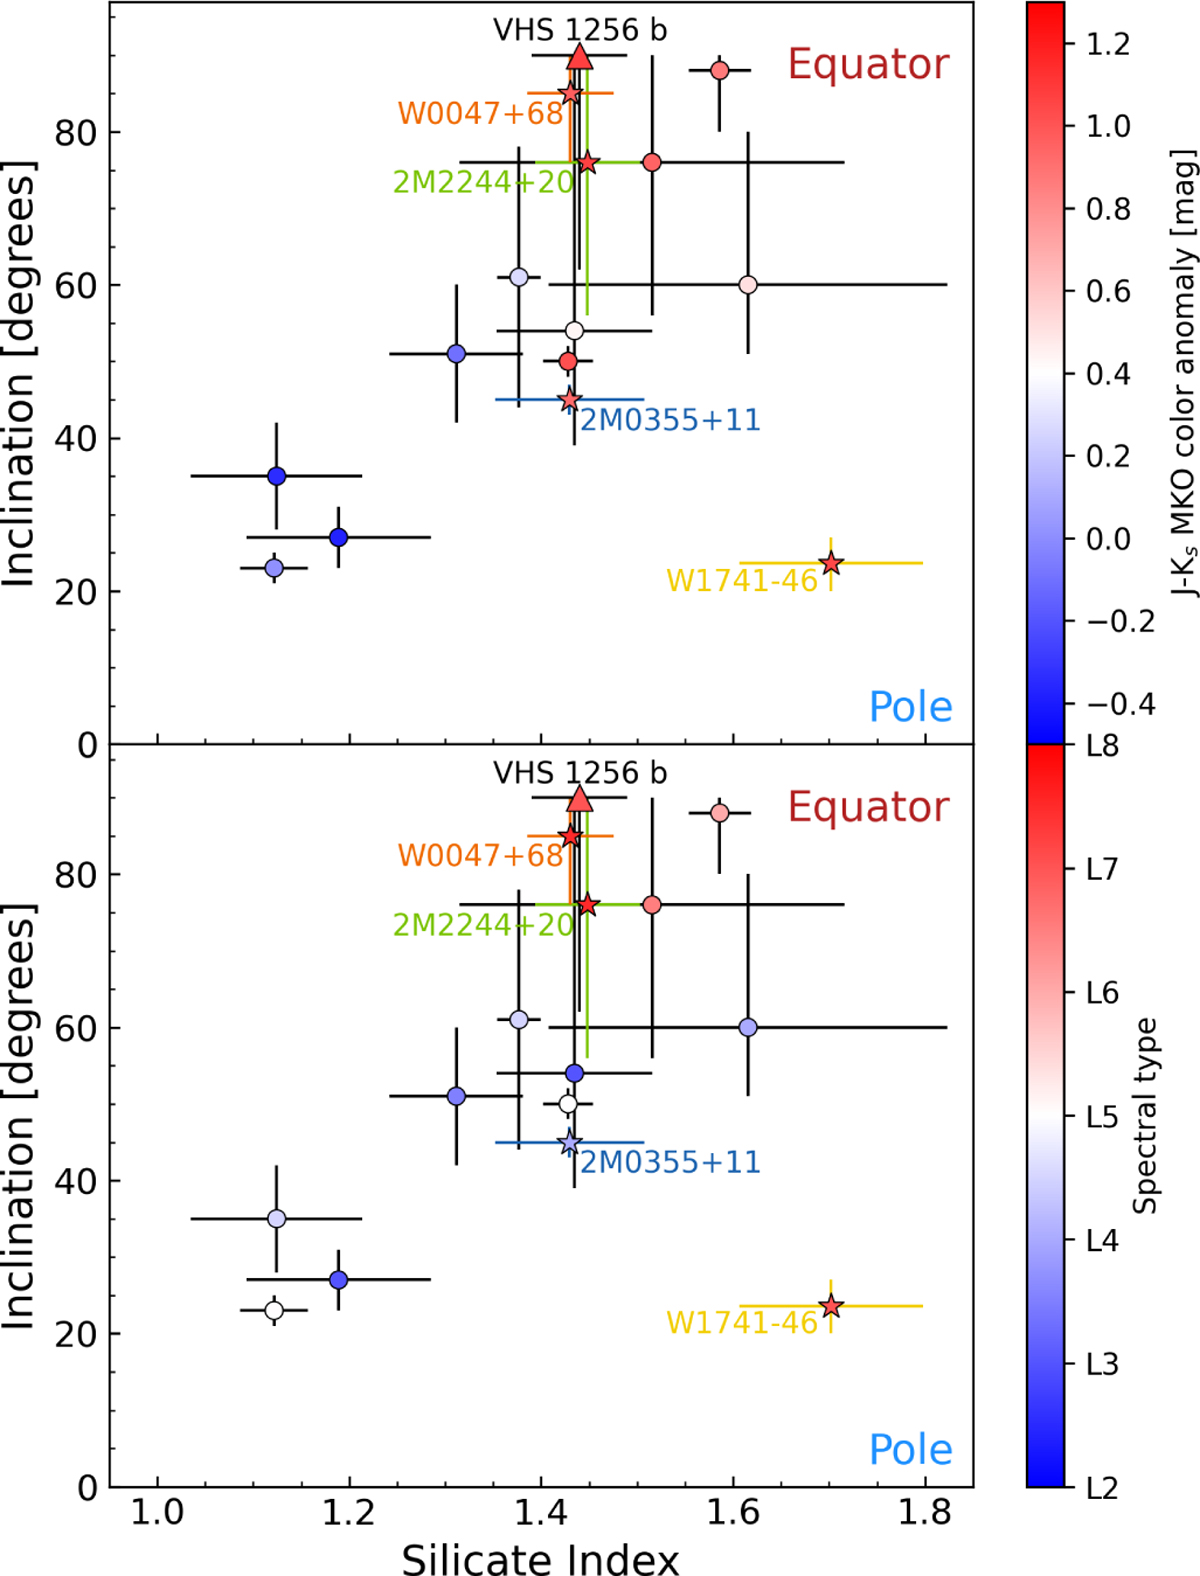
Correlation between the inclination and the silicate index for our sample (stars) compared with the Spitzer sample (circles) from Suárez et al. (2023). VHS 1256 b is also included with a triangle marker and black error bars. The upper panel is colour-coded according to the J-KS MKO colour anomaly calculated from young objects in the Ultracool-Sheet (Best et al. 2024). The lower panel is colour-coded according to the spectral type of each object. 2M0642+41 is not present in this figure, as it is a T dwarf with no silicate absorption feature present in the spectrum.
Current usage metrics show cumulative count of Article Views (full-text article views including HTML views, PDF and ePub downloads, according to the available data) and Abstracts Views on Vision4Press platform.
Data correspond to usage on the plateform after 2015. The current usage metrics is available 48-96 hours after online publication and is updated daily on week days.
Initial download of the metrics may take a while.