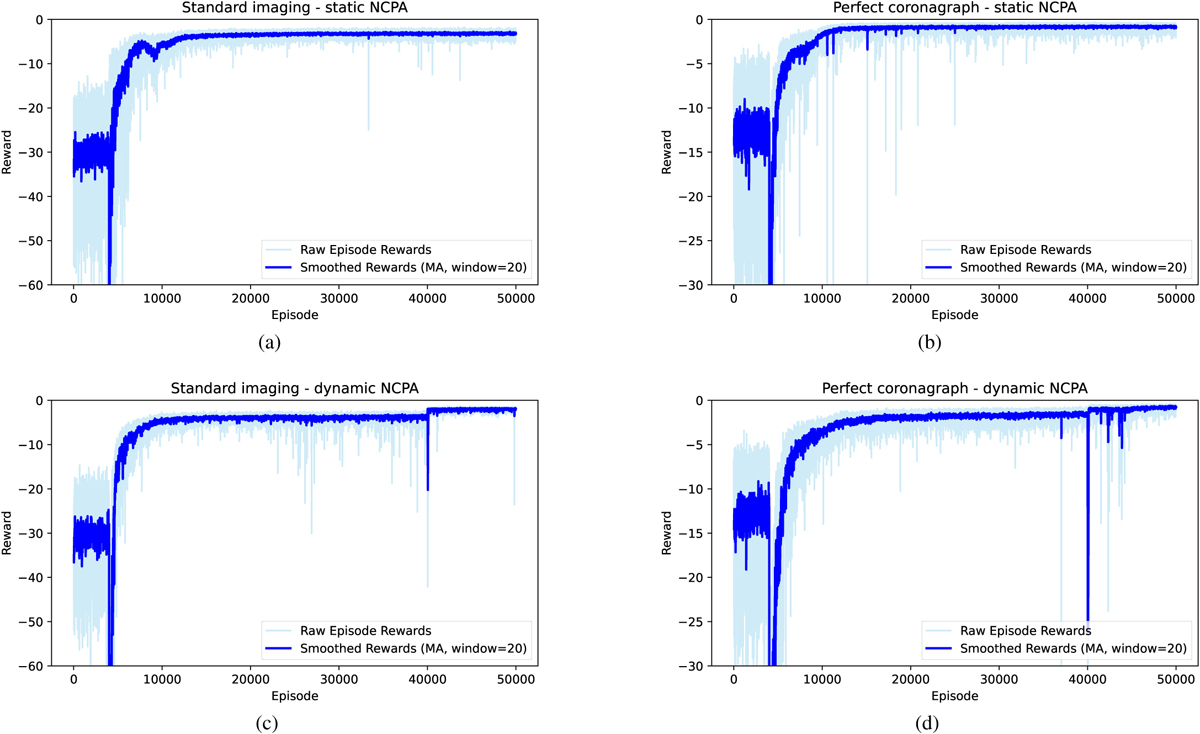
Fig. 4
Download original image
Training plots of PO4NCPA on circular pupil with SI and PC. Here we plot the negative cumulative reward (loss) after each episode in the training circle. The light blue curve shows the raw negative reward, and the dark blue shows the smoothed value (moving average). For the dynamic case (c, d), the DM is flattened only at the start of the episode for the first 40k episodes to prevent saturation. Afterward, each episode starts from the previous endpoint, thereby mimicking a continuously updated closed-loop control system. Hence, the bigger episode reward after that.
Current usage metrics show cumulative count of Article Views (full-text article views including HTML views, PDF and ePub downloads, according to the available data) and Abstracts Views on Vision4Press platform.
Data correspond to usage on the plateform after 2015. The current usage metrics is available 48-96 hours after online publication and is updated daily on week days.
Initial download of the metrics may take a while.