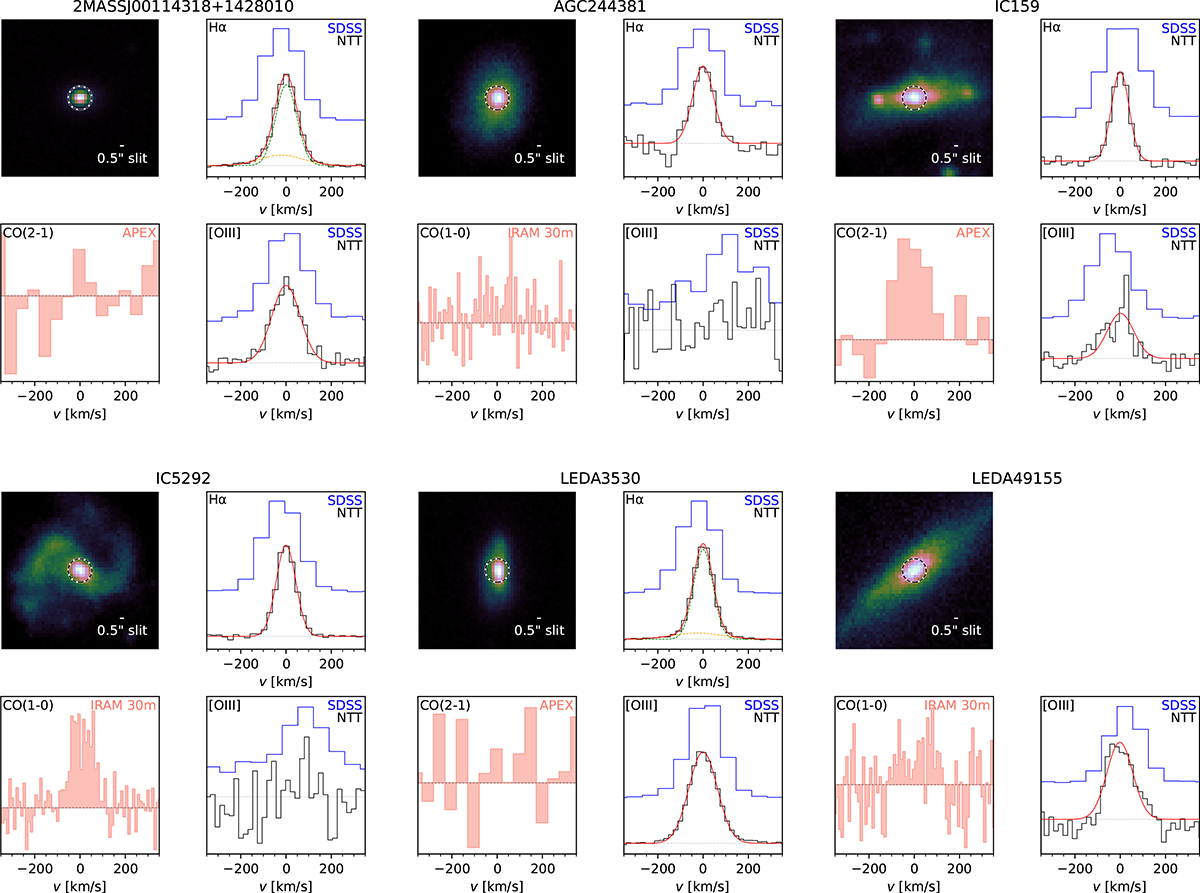
Fig. C.1.
Download original image
Targets observed with NTT/EFOSC2. The image on the top left in each panel shows the SDSS r-band image of the target, with the size and position of the 3” SDSS fiber shown as a black and white dashed circle. The white bar in each image shows the size of the slit used in the NTT/EFOSC2 spectroscopy. On the top right in each panel we show the SDSS (on top in blue) and higher resolution NTT/EFOSC2 (below in black) spectra around the Hα emission line at 6562.8 Å. On the bottom right in each panel is the same plot for the [OIII] emission line at 5006.77 Å. For emission lines detected with S/N> 3 we also show the best fit model in red. If the model has multiple components, individual components are shown as dashed curves in green (non-outflow components) and orange (outflow components). On the bottom left is the region around the CO(1-0) or CO(2-1) emission line, whichever was used in the analysis, from the ALLSMOG and xCOLDGASS surveys. This figure is continued below in Figs. C.2, C.3, C.4, and C.5.
Current usage metrics show cumulative count of Article Views (full-text article views including HTML views, PDF and ePub downloads, according to the available data) and Abstracts Views on Vision4Press platform.
Data correspond to usage on the plateform after 2015. The current usage metrics is available 48-96 hours after online publication and is updated daily on week days.
Initial download of the metrics may take a while.