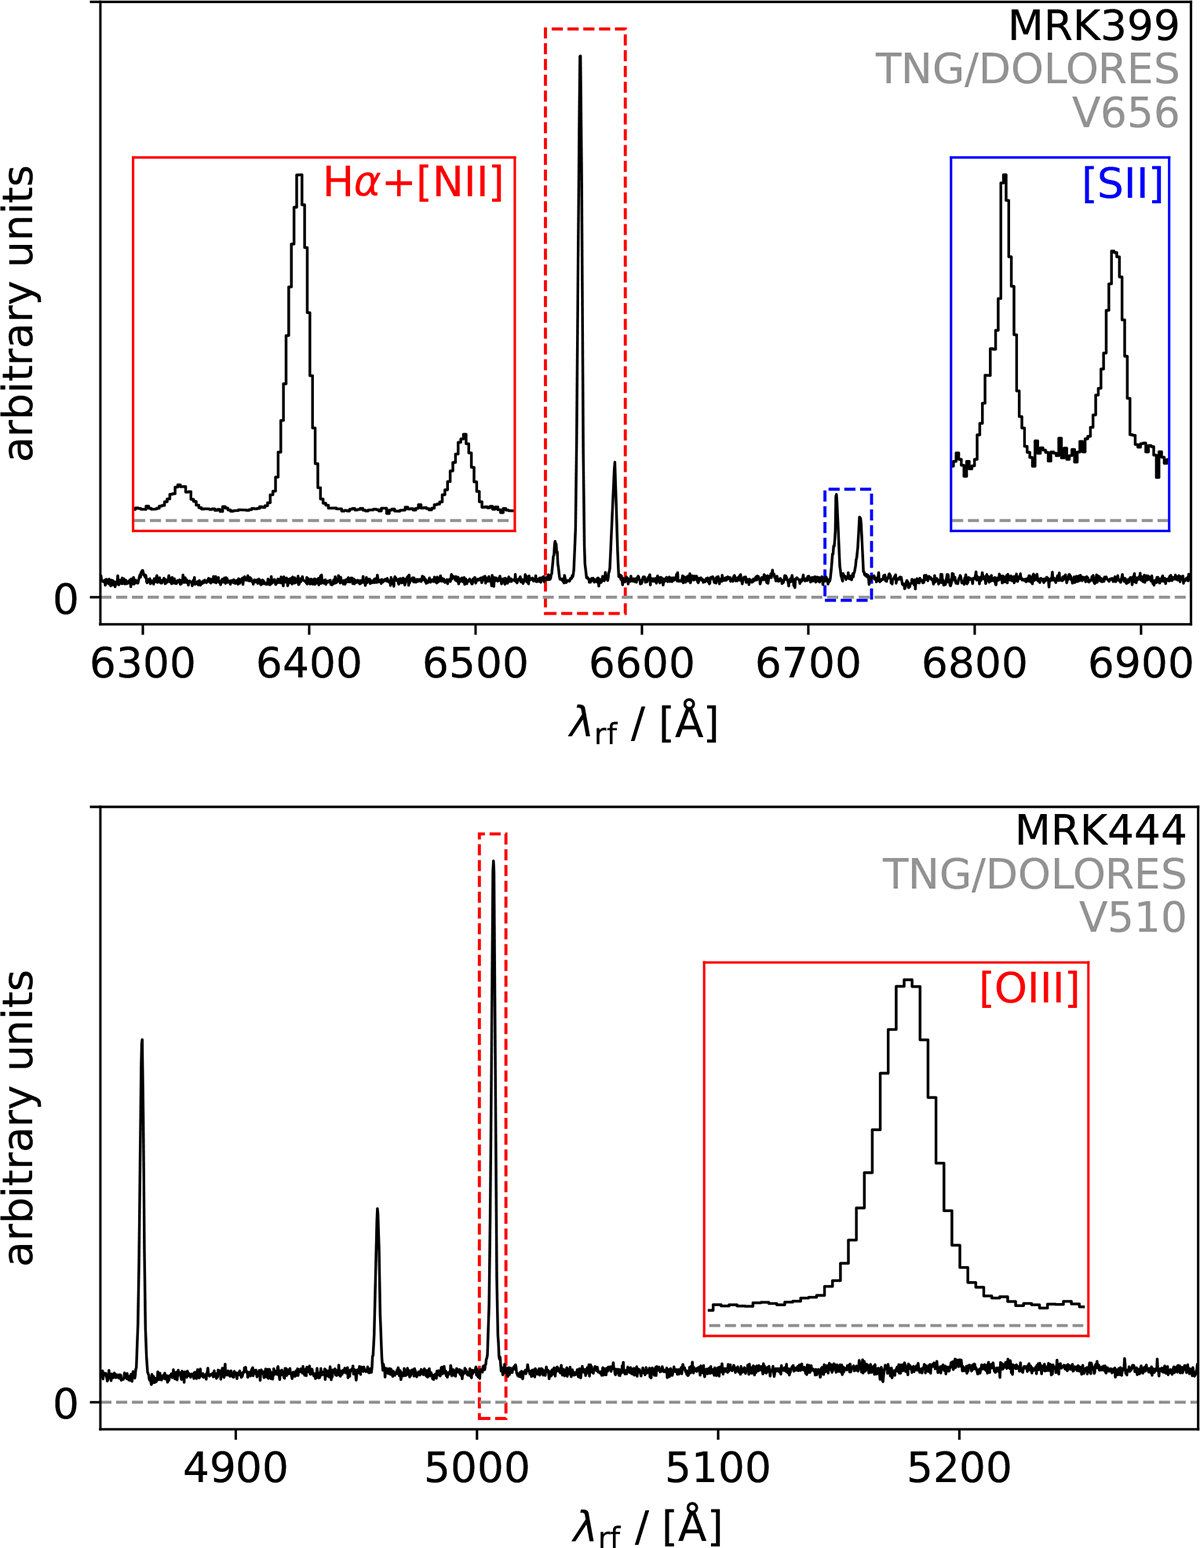
Fig. 2.
Download original image
Example spectra obtained with TNG/DOLORES spectroscopy using the V656 and V510 grisms with a 1.0″ slit. We note that these spectra do not have their absolute flux calibrated, so units on the y-axis are arbitrary. The dashed gray line shows the zero flux level. Insets show a more detailed view of select emission lines, with the size of the zoomed-in region shown by the dashed colored boxes.
Current usage metrics show cumulative count of Article Views (full-text article views including HTML views, PDF and ePub downloads, according to the available data) and Abstracts Views on Vision4Press platform.
Data correspond to usage on the plateform after 2015. The current usage metrics is available 48-96 hours after online publication and is updated daily on week days.
Initial download of the metrics may take a while.