Fig. 4.
Download original image
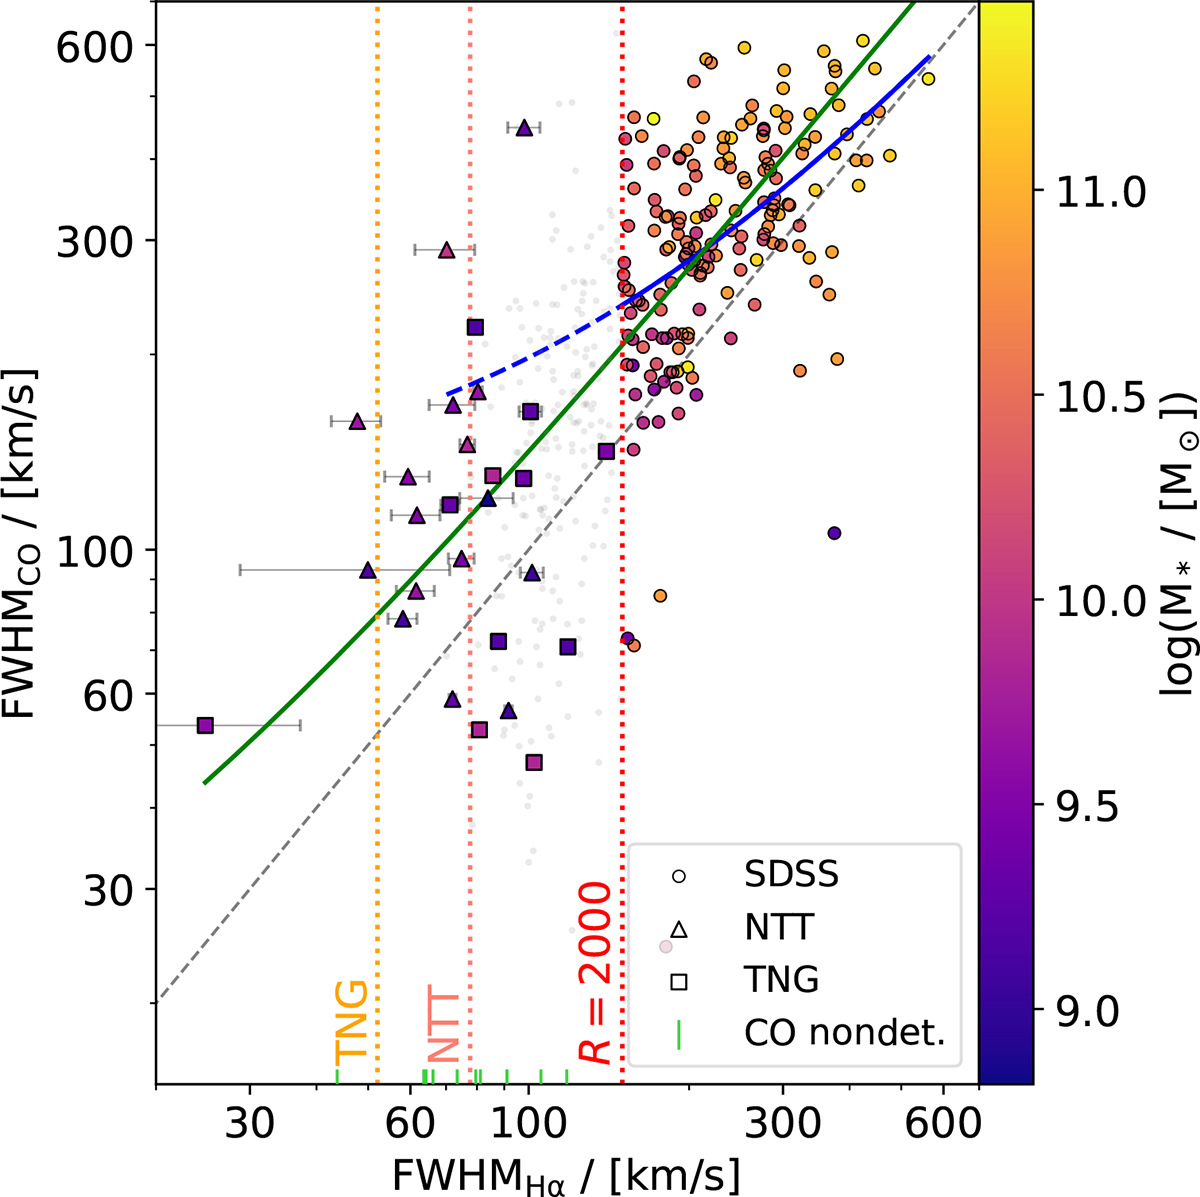
Same as Fig. 1, but with line widths inferred from high-resolution spectroscopy replacing data unresolved by SDSS (the unresolved data are still shown as gray dots). The solid green line shows a linear fit to the combined SDSS resolved and high-resolution data. The solid blue line shows the same linear fit to the resolved SDSS data as in Fig. 1, extrapolated to the SDSS-unresolved regime as a dashed line. Targets without detections in CO are marked with vertical line markers on the x-axis at the position corresponding to their Hα line widths inferred from their NTT or TNG spectra. Dotted vertical lines show the approximate SDSS resolution R = 2000 (FWHM ∼ 150 km/s), and the median resolution for the sample achieved with TNG (FWHM ∼ 52 km/s) and NTT (FWHM ∼ 78 km/s) for the Hα line.
Current usage metrics show cumulative count of Article Views (full-text article views including HTML views, PDF and ePub downloads, according to the available data) and Abstracts Views on Vision4Press platform.
Data correspond to usage on the plateform after 2015. The current usage metrics is available 48-96 hours after online publication and is updated daily on week days.
Initial download of the metrics may take a while.