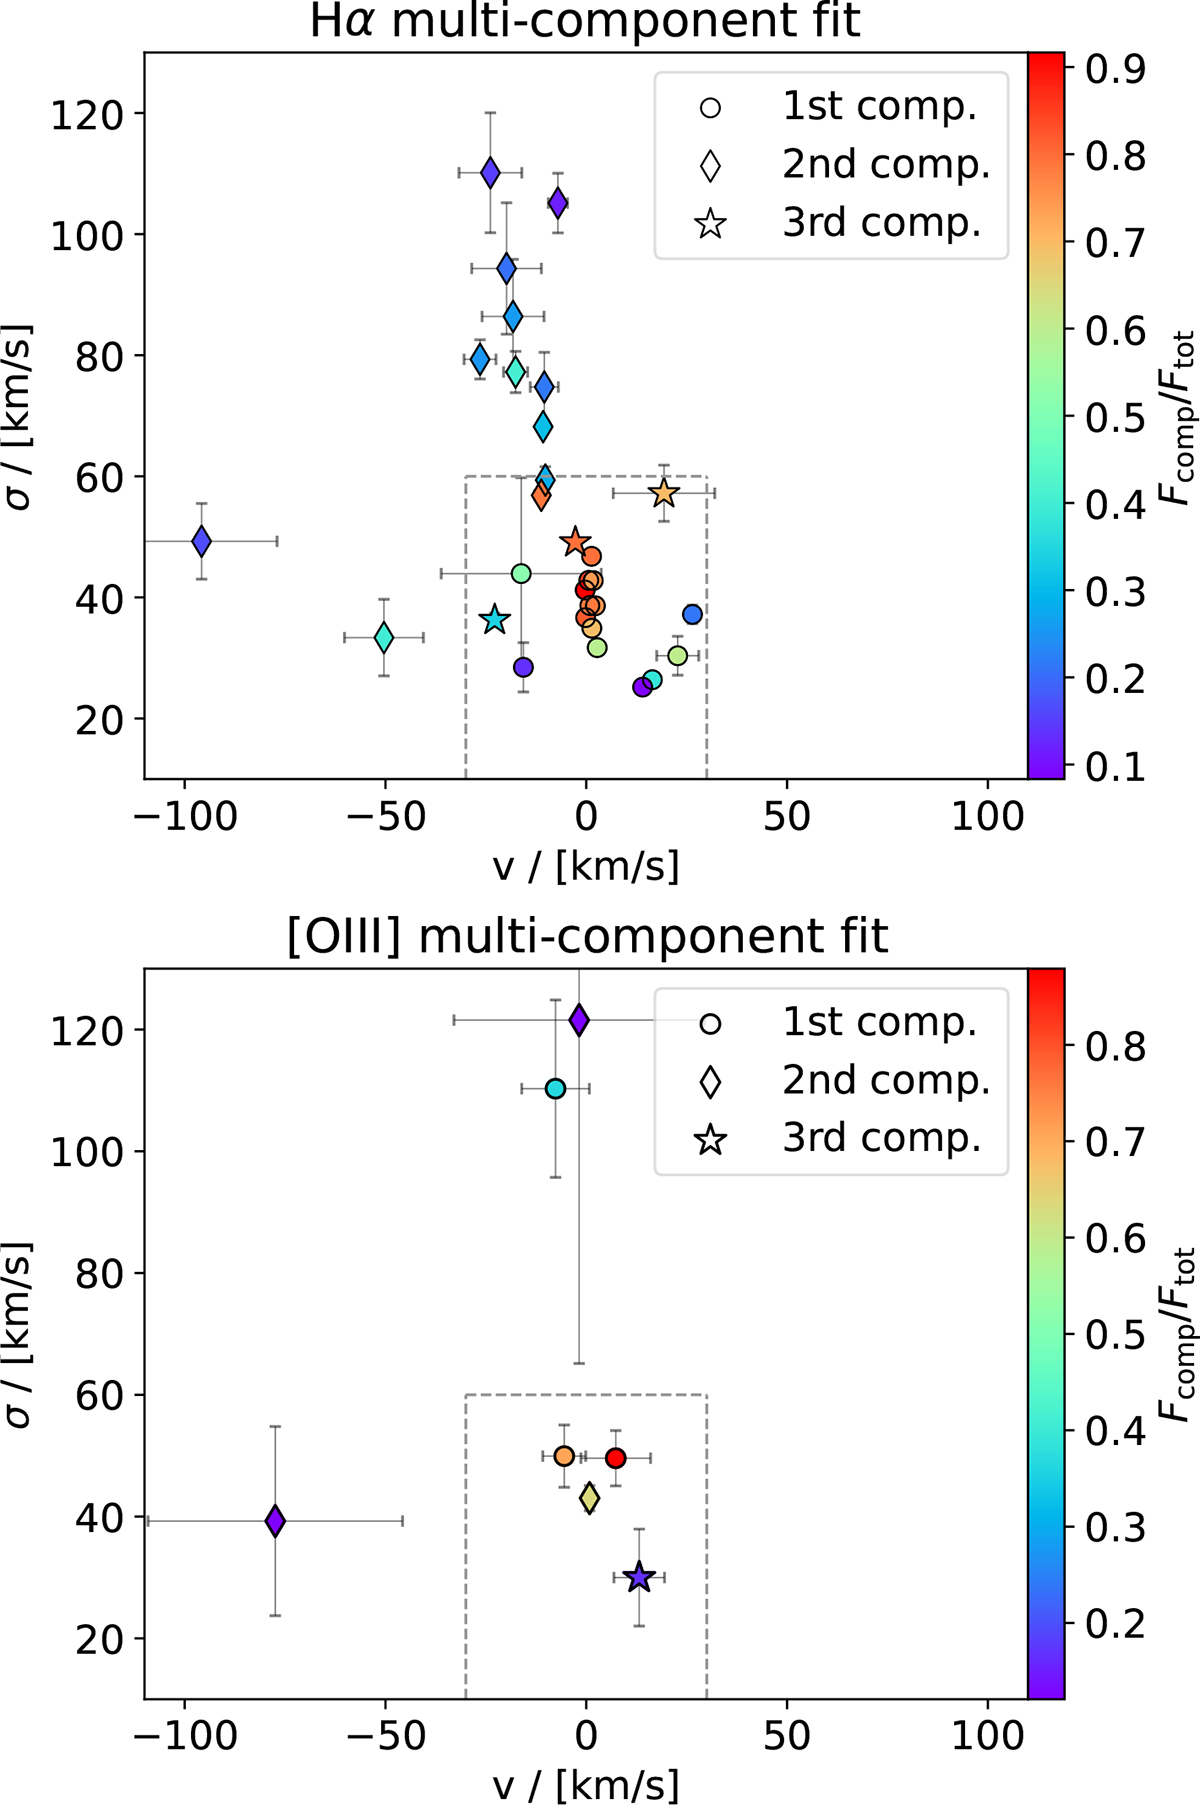
Fig. 8.
Download original image
Central velocity v and velocity dispersion σ of all components in the best-fit multi-Gaussian model across all galaxies in which the relevant line is detected and required multiple components to fit. The top panel shows the results of the fit to the Hα emission line and the bottom panel the [OIII] emission line. The color scale shows the flux of the component relative to the total flux summed over all components in the best-fit model. The dashed gray rectangle corresponds to ±30 km/s in v and 60 km/s in σ, and marks the separation between components tracing potential outflow signatures and those tracing rotating gas. Numbering of the components only reflects the order in which they are added during the iterative fitting procedure.
Current usage metrics show cumulative count of Article Views (full-text article views including HTML views, PDF and ePub downloads, according to the available data) and Abstracts Views on Vision4Press platform.
Data correspond to usage on the plateform after 2015. The current usage metrics is available 48-96 hours after online publication and is updated daily on week days.
Initial download of the metrics may take a while.