Fig. A.1.
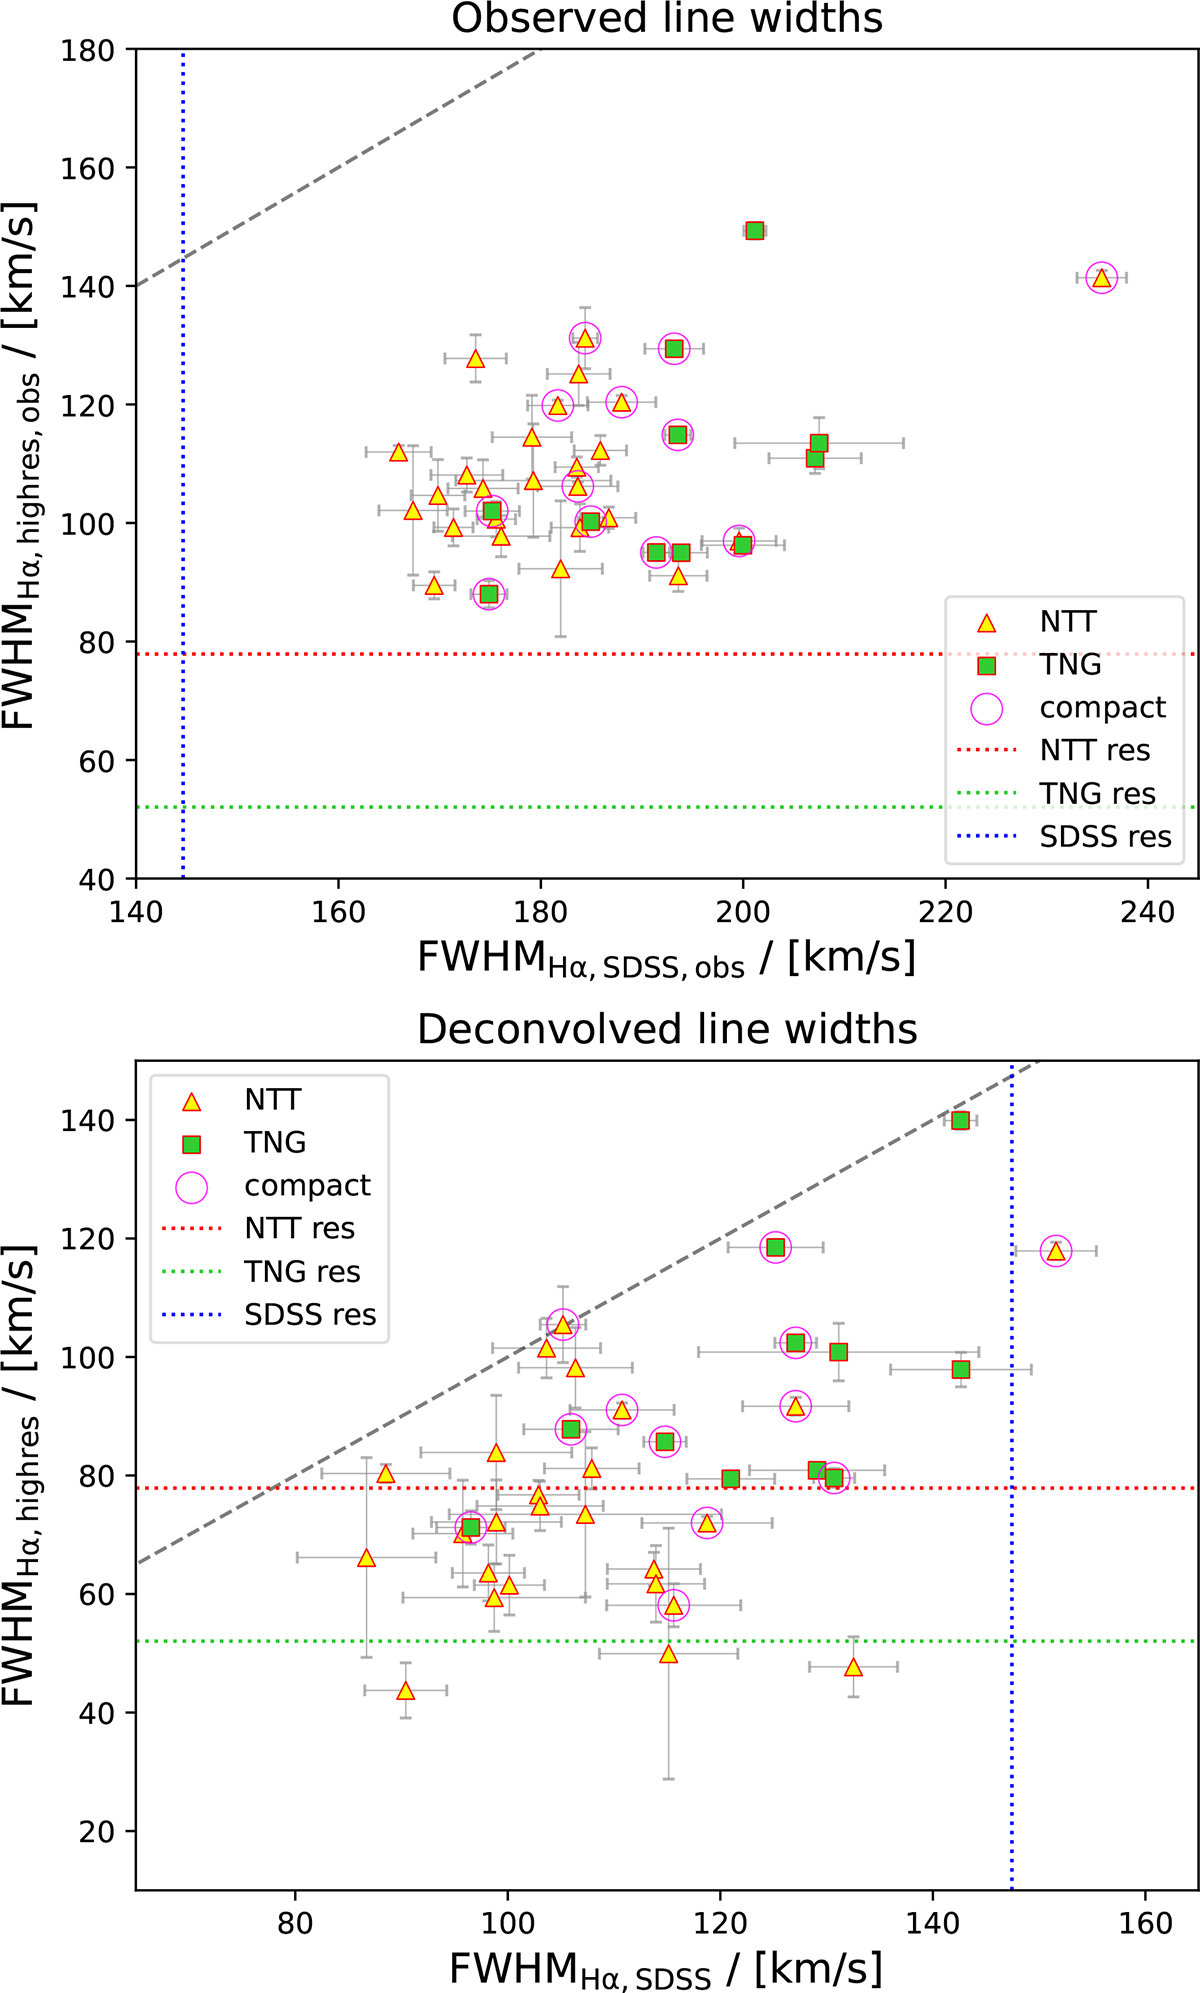
Download original image
Comparison between Hα line widths measured using SDSS and TNG/NTT. The top panel shows the observed values, while the bottom panel shows the values obtained after subtracting in quadrature the instrumental resolution. The average resolution for the three instruments is shown by colored dotted lines for reference. Magenta circles mark 12 particularly compact galaxies, for which over 30 percent of r-band flux from a 10” aperture is contained within the 3” SDSS fiber. The gray dashed line shows the one-to-one relation. We show only galaxies in which Hα is detected with an S/N greater than 3 and for which the uncertainty on the best-fit line width does not exceed the line widths itself. We chose these thresholds to exclude galaxies in which the line width cannot be determined accurately.
Current usage metrics show cumulative count of Article Views (full-text article views including HTML views, PDF and ePub downloads, according to the available data) and Abstracts Views on Vision4Press platform.
Data correspond to usage on the plateform after 2015. The current usage metrics is available 48-96 hours after online publication and is updated daily on week days.
Initial download of the metrics may take a while.