Fig. 4.
Download original image
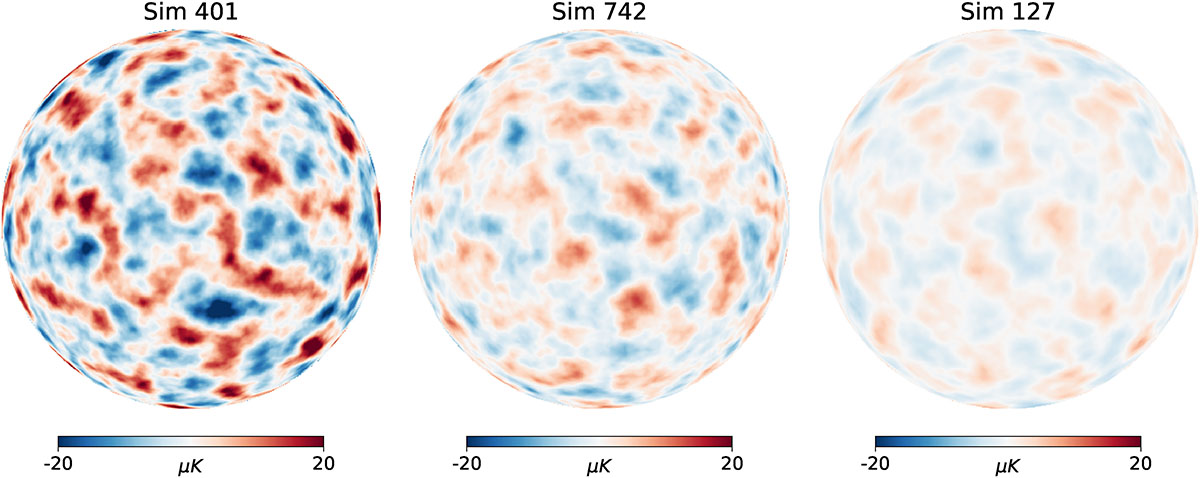
Sky-maps of the ISW signal, showing half of the sky in an orthographic projection. Three representatives correspond to simulations 401 (w = −0.34), 742 (w = −1), and 127 (w = −1.79), which highlight different dark energy EoS. These maps are colour-coded based on the ISW temperature anisotropies in μK. The quintessence model shows the most pronounced colours, indicating the strongest ISW signal, followed by the ΛCDM model, while the phantom model shows the weakest signal (see also Figure 5 for comparison).
Current usage metrics show cumulative count of Article Views (full-text article views including HTML views, PDF and ePub downloads, according to the available data) and Abstracts Views on Vision4Press platform.
Data correspond to usage on the plateform after 2015. The current usage metrics is available 48-96 hours after online publication and is updated daily on week days.
Initial download of the metrics may take a while.