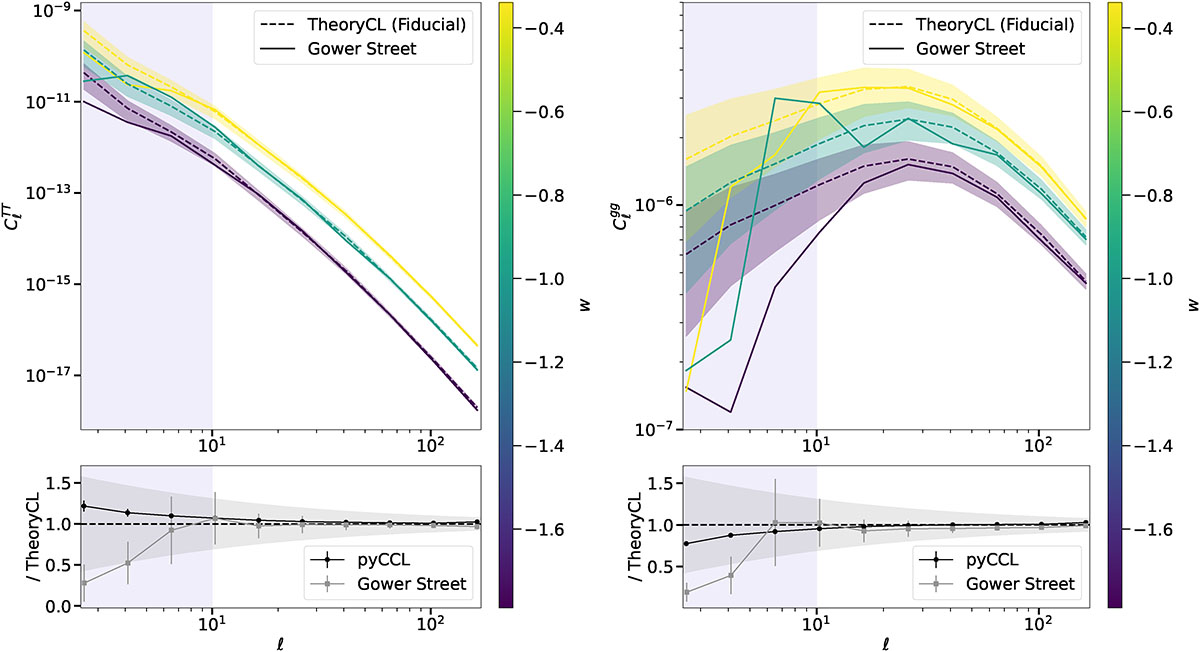
Fig. 6.
Download original image
Theoretical vs. map-based power spectra for ISW auto-correlations (left) and galaxy auto-correlations (right). Top panels: Three characteristic models with different w parameters, comparing the measured value from pyGenISW and anafast (solid) with the theoretical expectations from TheoryCL (dashed). We mark the limitations due to cosmic variance (shaded about dashed lines) and also the ℓ < 10 range where we expect to have imperfect density and ISW maps due to the GS box size limitations. Bottom panels: Statistical results for the agreement of the fiducial TheoryCL and alternative pyCCL theoretical pipelines, and also a comparison between theory and map-based results for the ensemble of the GS mocks. We report good agreement, with a slight deficit of power at small scales (ℓ ≥ 100) where the ISW signal is weakest, and where linear theory assumptions might break down first.
Current usage metrics show cumulative count of Article Views (full-text article views including HTML views, PDF and ePub downloads, according to the available data) and Abstracts Views on Vision4Press platform.
Data correspond to usage on the plateform after 2015. The current usage metrics is available 48-96 hours after online publication and is updated daily on week days.
Initial download of the metrics may take a while.