Open Access
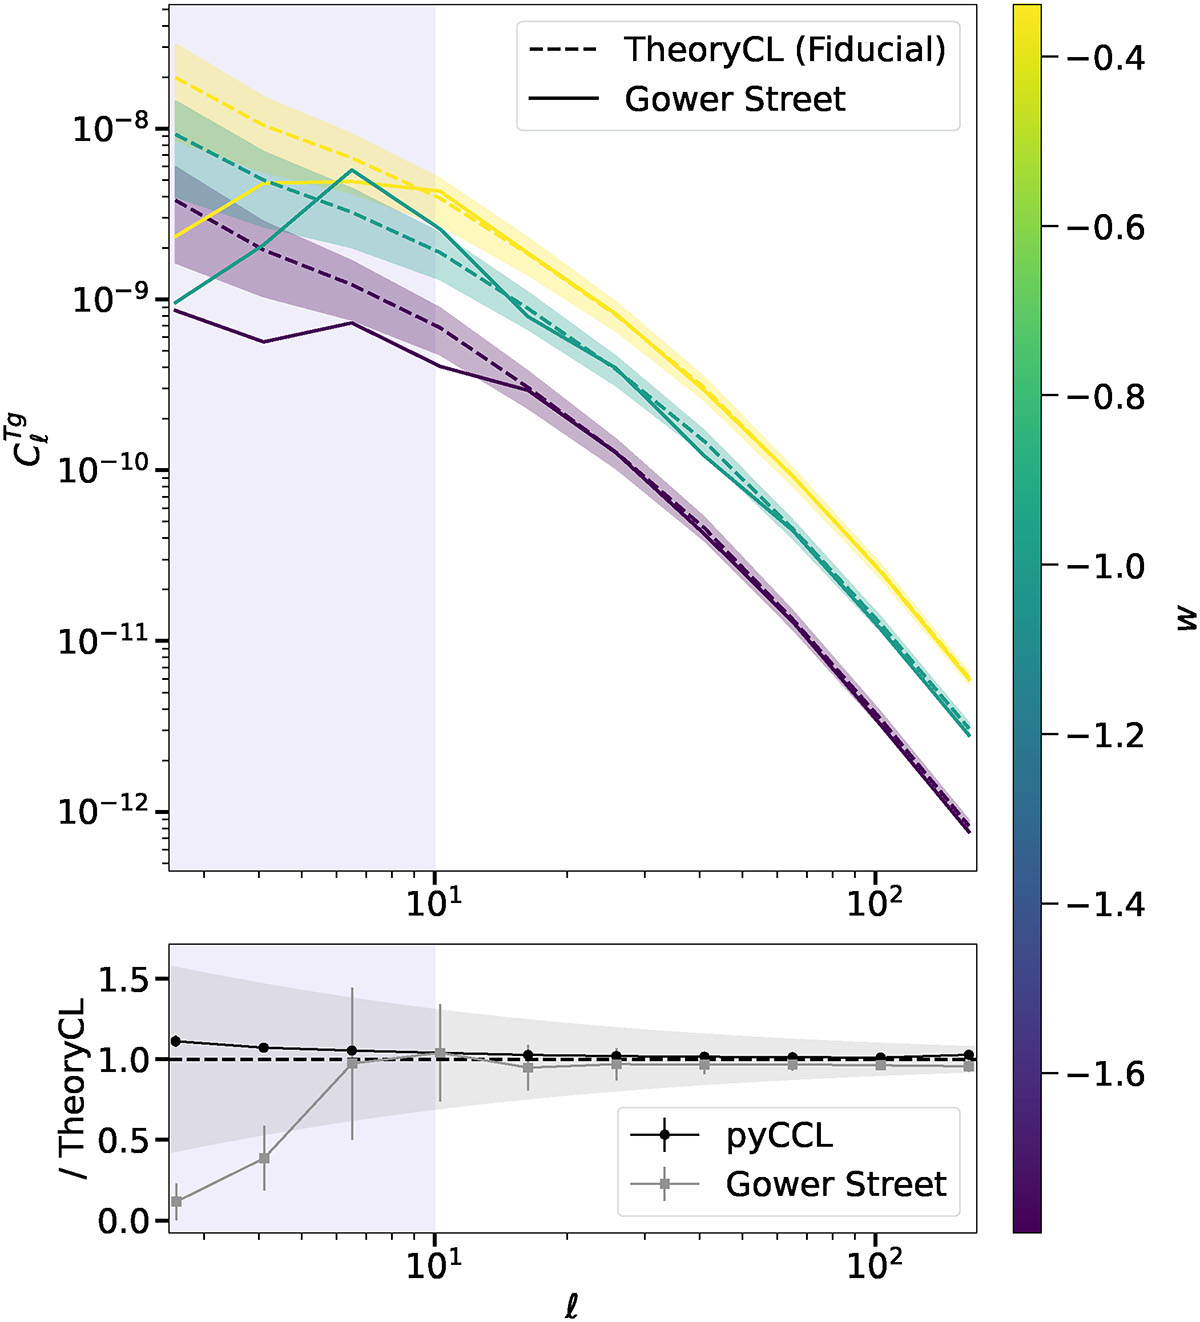
Fig. 7.
Download original image
Similar to Figure 6, but for the galaxy-ISW cross-correlation. Different simulations with varying w parameters show different power spectrum amplitudes, and the overall agreement is great between theory and map-based results, except for the lowest and highest ℓ-ranges.
Current usage metrics show cumulative count of Article Views (full-text article views including HTML views, PDF and ePub downloads, according to the available data) and Abstracts Views on Vision4Press platform.
Data correspond to usage on the plateform after 2015. The current usage metrics is available 48-96 hours after online publication and is updated daily on week days.
Initial download of the metrics may take a while.