Fig. 9.
Download original image
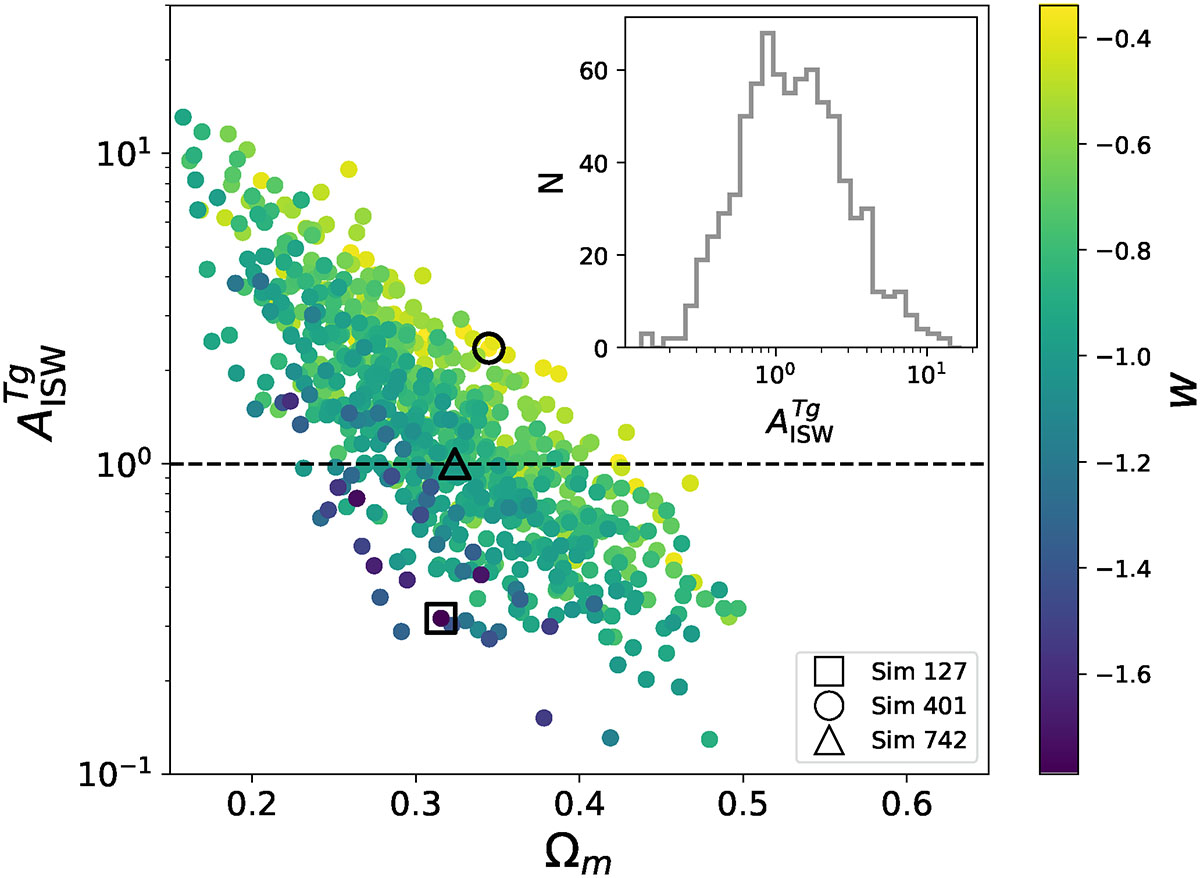
ISW amplitude ![]() , computed from power spectra ratios for 777 simulations spanning a wide range of wCDM cosmological parameters. The main scatter plot shows
, computed from power spectra ratios for 777 simulations spanning a wide range of wCDM cosmological parameters. The main scatter plot shows ![]() as a function of Ωm, with points colour-coded by w. Three representative simulations (Sim 127, Sim 401, and Sim 742) are highlighted with unfilled black markers. The horizontal dashed line indicates the fiducial ΛCDM expectation
as a function of Ωm, with points colour-coded by w. Three representative simulations (Sim 127, Sim 401, and Sim 742) are highlighted with unfilled black markers. The horizontal dashed line indicates the fiducial ΛCDM expectation ![]() . The inset histogram shows the distribution of the
. The inset histogram shows the distribution of the ![]() , also showing a broad variation in ISW strength across cosmological models.
, also showing a broad variation in ISW strength across cosmological models.
Current usage metrics show cumulative count of Article Views (full-text article views including HTML views, PDF and ePub downloads, according to the available data) and Abstracts Views on Vision4Press platform.
Data correspond to usage on the plateform after 2015. The current usage metrics is available 48-96 hours after online publication and is updated daily on week days.
Initial download of the metrics may take a while.