Fig. 1
Download original image
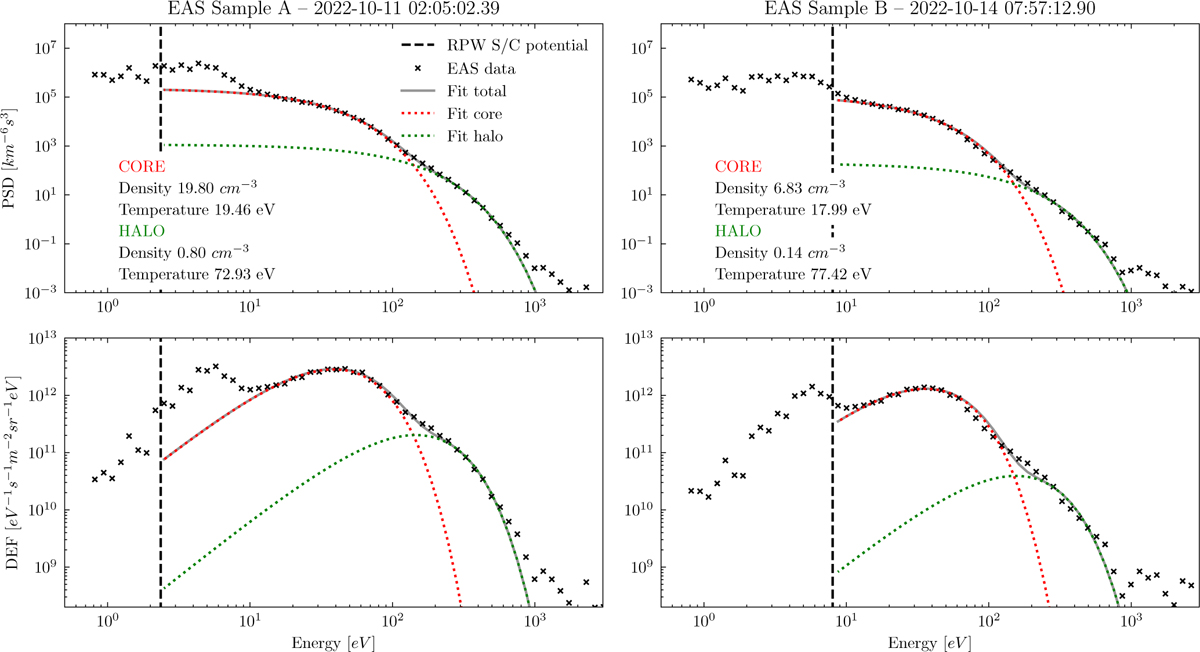
Electron PSD (upper panels) and DEF (lower panels) as measured by SWA-EAS are shown (black crosses) as a function of the energy for the selected samples, A (left) and B (right). Measured data are over-plotted by a fit with a simple model (grey line) composed from a sum of two Maxwellian distributions for the core (red) and halo (green) ambient electron populations. Displayed fitted plasma parameters are corrected to the spacecraft potential energy measured by RPW (vertical dashed black line).
Current usage metrics show cumulative count of Article Views (full-text article views including HTML views, PDF and ePub downloads, according to the available data) and Abstracts Views on Vision4Press platform.
Data correspond to usage on the plateform after 2015. The current usage metrics is available 48-96 hours after online publication and is updated daily on week days.
Initial download of the metrics may take a while.