Fig. 3
Download original image
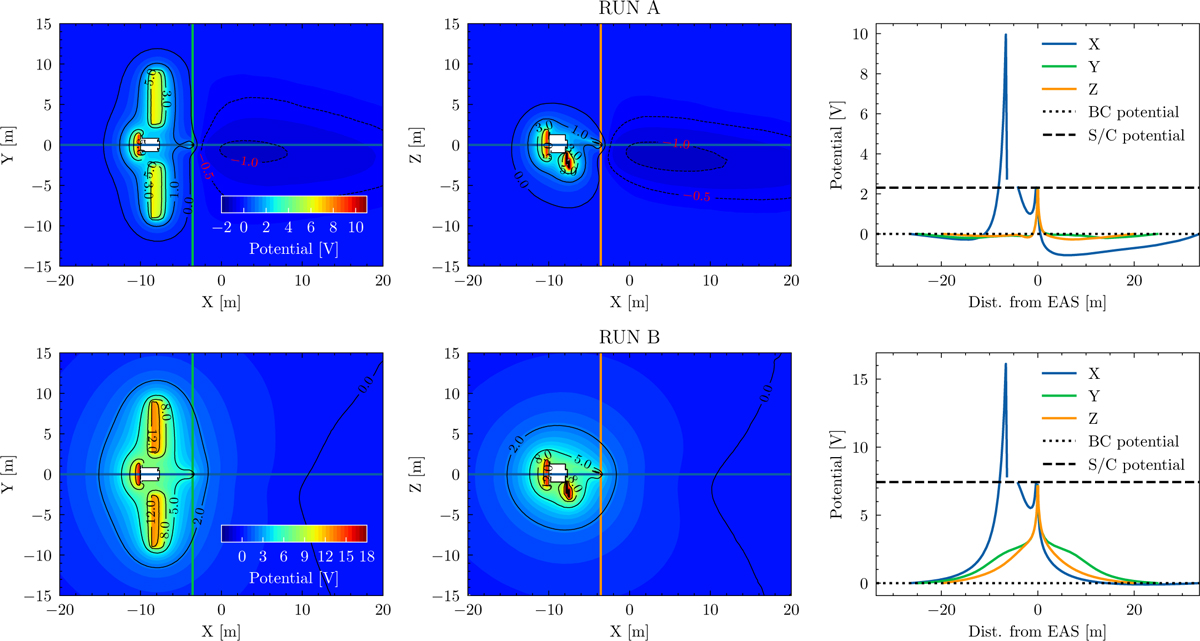
Final structure of the potential around the spacecraft body is shown for simulation run A (top row) and run B (bottom row) at time t=1.5 s. The left and middle columns show the 2D cuts in the XY and XZ planes, respectively. The right column shows potential profiles along the X (blue), Y (green), and Z (orange) axes as a function of the distance from the virtual SWA-EAS detector. The dashed line in the right panel displays the final surface spacecraft potential and the dotted line line shows the background (zero) plasma potential for reference.
Current usage metrics show cumulative count of Article Views (full-text article views including HTML views, PDF and ePub downloads, according to the available data) and Abstracts Views on Vision4Press platform.
Data correspond to usage on the plateform after 2015. The current usage metrics is available 48-96 hours after online publication and is updated daily on week days.
Initial download of the metrics may take a while.