Fig. 4
Download original image
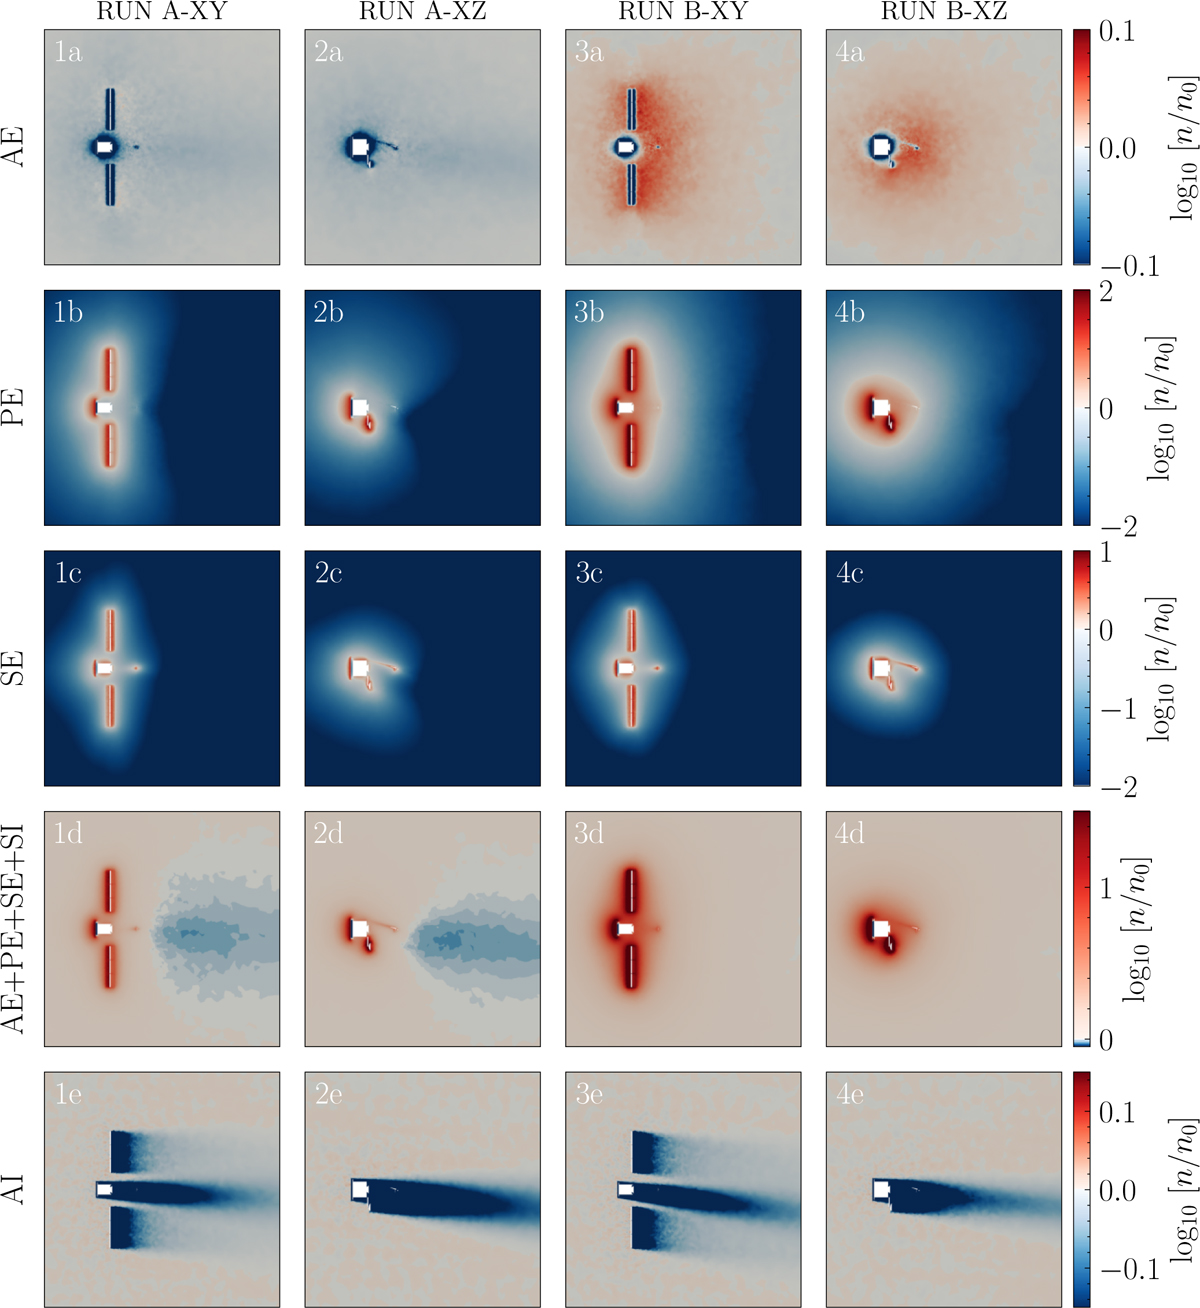
Electron and ion densities at the final simulation time, t=1.5 s, are shown for run A (columns 1 and 2) and run B (columns 3 and 4) as 2D slices in the XY and XZ plane: row 1a-4a for ambient electrons (AE), row 1b-4b for photoelectrons (PE), row 1c-4c for secondary electrons from electron impacts (SE), row 1d-4d total electron density (AE+PE+SE+SI), and row 1e-4e for ambient ion density (AI). All densities are normalized to the initial ambient plasma density, n0, and plotted on a logarithmic scale showing a relative increase in densities in red and decrease in densities in blue.
Current usage metrics show cumulative count of Article Views (full-text article views including HTML views, PDF and ePub downloads, according to the available data) and Abstracts Views on Vision4Press platform.
Data correspond to usage on the plateform after 2015. The current usage metrics is available 48-96 hours after online publication and is updated daily on week days.
Initial download of the metrics may take a while.