Open Access
Fig. 5
Download original image
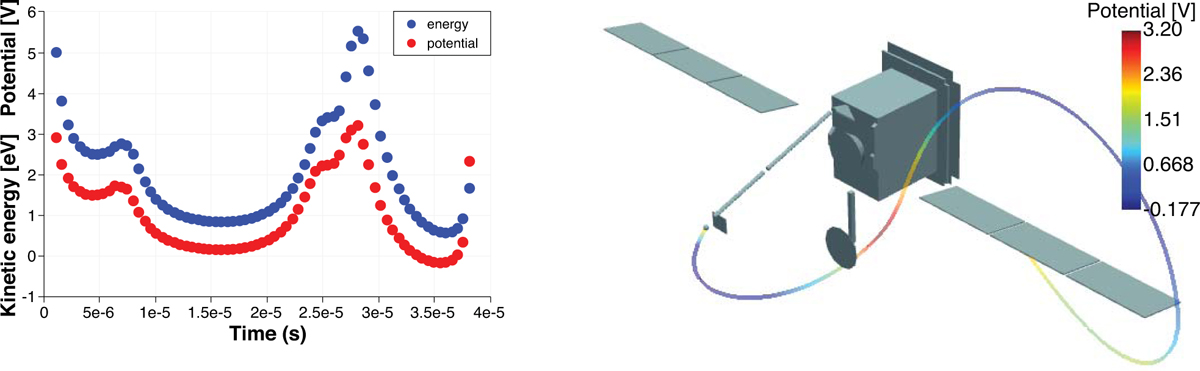
Example of photoelectron trajectory emitted from the solar panel and impacting the surface of the SWA-EAS detector. Change in the electron kinetic energy (blue) and potential (red) along the trajectory is shown in the left panel as a function of the time of flight. The sample trajectory is taken from the simulation run A.
Current usage metrics show cumulative count of Article Views (full-text article views including HTML views, PDF and ePub downloads, according to the available data) and Abstracts Views on Vision4Press platform.
Data correspond to usage on the plateform after 2015. The current usage metrics is available 48-96 hours after online publication and is updated daily on week days.
Initial download of the metrics may take a while.