Fig. 7
Download original image
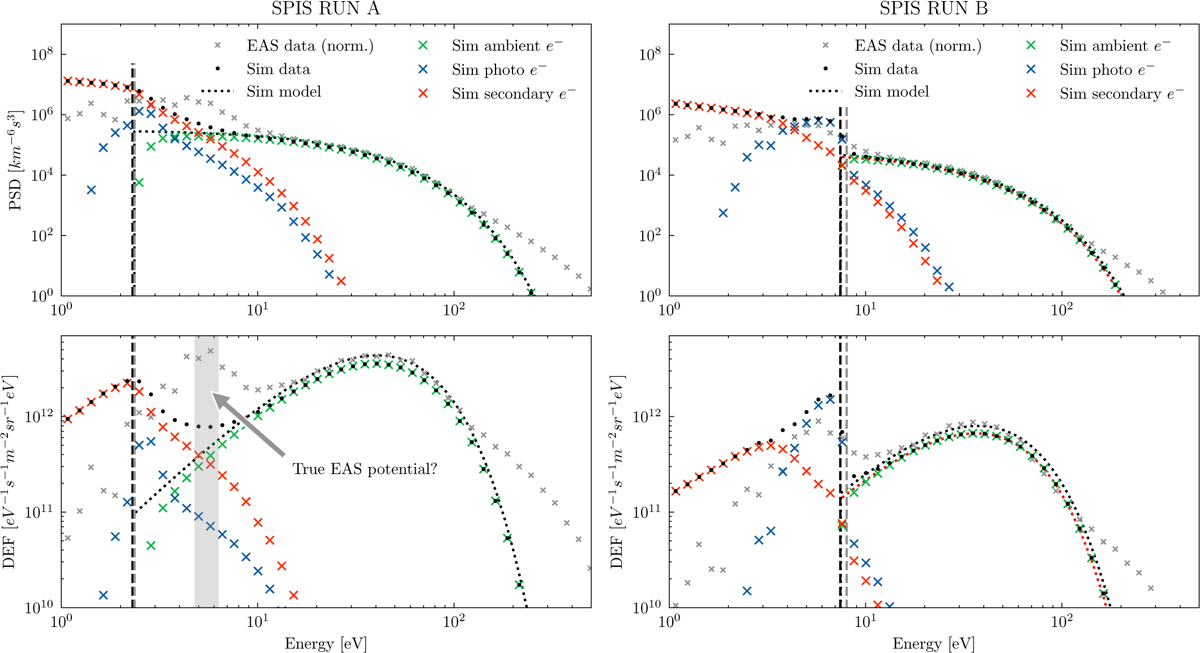
Phase space densities (upper panels) and DEF (lower panels) are shown decomposed into individual contributions of the ambient solar wind (green), secondary (red), and photoelectrons (blue) in comparison to total simulation (black dots) and real SWA-EAS measurements (grey crosses) for both run A (left) and run B (right). Simulated data are over-plotted by the model (dotted line) for ambient background Maxwellian plasma. The simulated spacecraft potential (dashed black line) and the spacecraft potential as measured by RPW is shown for comparison (vertical dashed grey line). The shaded grey area shows the possible location of the real effective potential of the SWA-EAS detector.
Current usage metrics show cumulative count of Article Views (full-text article views including HTML views, PDF and ePub downloads, according to the available data) and Abstracts Views on Vision4Press platform.
Data correspond to usage on the plateform after 2015. The current usage metrics is available 48-96 hours after online publication and is updated daily on week days.
Initial download of the metrics may take a while.