Fig. 8
Download original image
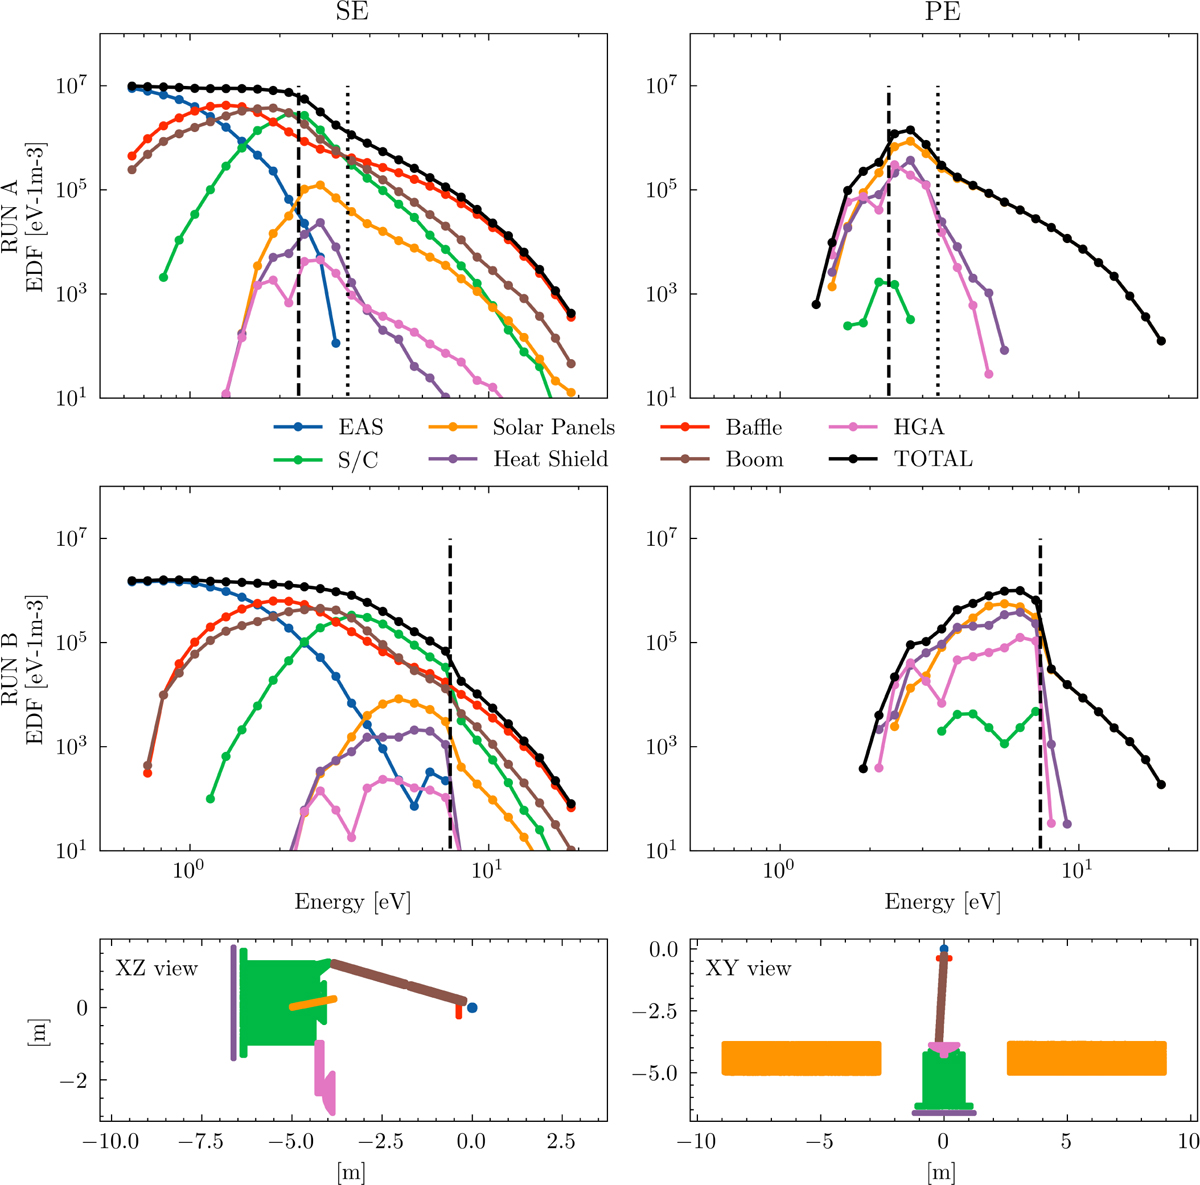
Individual contributions to electron energy distribution function (EDF) as measured by virtual SWA-EAS in the simulation run A (top row) and run B (middle row) are shown as a function of the energy for different source surface locations of the secondary emissions (left panels) and photo-emission (right panels): the SWA-EAS (blue), the spacecraft body (green), the solar panels (orange), the heat shield (purple), the boom (brown), the SWA-EAS baffle (red), and the HG antenna (pink). The simulated spacecraft potential is plotted with the vertical dashed black line for reference. In the top row (run A) the dotted line represents the additional potential barrier created in the spacecraft wake. The geometry of the source locations projected to the XZ and YX plane is plotted in the bottom panels.
Current usage metrics show cumulative count of Article Views (full-text article views including HTML views, PDF and ePub downloads, according to the available data) and Abstracts Views on Vision4Press platform.
Data correspond to usage on the plateform after 2015. The current usage metrics is available 48-96 hours after online publication and is updated daily on week days.
Initial download of the metrics may take a while.